Visualise your Azure Table Storage data with Power BI


With Power BI now in public preview everywhere, you don't need to be a "data scientist" to do data science!
Power BI is a powerful tool for visualising performance, user interactions and other data for your applications. There is so much useful data sitting passively in various storage accounts, hiding interesting trends or unwanted behaviour. Power BI offers a much nicer way to view this data than trawling through never-ending log files and spreadsheets.
Here are some steps to use Power BI to visualise data from an Azure Table.
How big is your data?
A word of caution before we proceed. Power Query and the Power BI Designer use a process called folding to push as much of the work of querying the data as possible back to the data source. There's more information about folding in this Channel 9 Deep dive into Power Query formula language – from 00:07:40.
If the source system can't carry out the operation, the work is done locally. In the case of Azure table storage, it may not be possible to execute the query at source, which can slow things up. If you have a lot of data in table storage, it might be best to carry out the initial processing in Azure using one or more Azure PaaS services such as Azure SQL Database, Stream Analytics or HDInsight.
Of course you could just use an Azure SQL Database instead of a table… but the scalability of Azure Table Storage is a big draw.
Power BI Designer or Excel?
I'm going to describe two alternative ways of getting data into Power BI – using Excel's Power Query add-in, and using the new Power BI Designer. Power BI Designer is a new dedicated report authoring tool for Power BI. It lets you ingest data from a wide range of sources, query it as you would with Power Query in Excel, and design Power BI reports
The process is very similar as Power BI Designer essentially wraps the Excel components you'd use to generate data for Power BI.
Because it's dedicated, Power BI Designer provides a nicer user experience. However, there's currently one drawback to Power BI Designer, which is that data refreshing from Power BI Designer files is not yet supported. Data refreshing is supported from Excel workbooks where Power Query is used to connect to and query data from certain types of sources, including Azure table storage.
Power BI Designer is still in preview – hopefully refreshing from these files will be supported soon (so if you're reading this article later than April 2015, have a look on the refresh data support article to see if things have changed!)
Steps using Excel
1. Import the data using Power Query
Install the Power Query Excel add-on if you don't have it already.
In Excel, on the Power Query tab, select Microsoft Azure Table Storage from the From Azure drop down menu.

You will be prompted to enter the name or URL of the storage account.
After this, if you haven't connected to the account before, you'll be prompted for the key.
The tables for the storage account will appear in the Navigator panel.

2. Query the data using Power Query
Double click on a table name in the Navigator panel to edit the data. This opens the Power Query Query Editor window.
All items other than partition key, row key and timestamp will be combined in a Content column. You can include other headings by clicking on the expand icon next to the heading Content.

At this point you might want to manipulate the data to filter the data, remove columns or rows, add columns, group data, pivot columns etc, before generating visual reports for the data. There are GUI options for all these operations and many more.
You might want to use some of the date filtering options, such as 'This week' to create reports for a particular time period.
Power Query uses a functional language called 'M' to manipulate data. As you carry out operations in the GUI, you can see steps corresponding to M operations appearing in the Applied Steps window (if this isn't visible, you can add it via the View tab > Query Settings).

To see the data is it is after any particular step, select the step. To undo a step, remove it from the Applied Steps window.
To see the M query for each operation you carry out in the GUI, check the Formula Bar box.

The full M script for your operations on the model can be viewed in the Advanced Editor.

Editor support for M is limited, but Notepad ++ offers syntax highlighting for the language.
When you are happy with the query, Close and Load To.

This gives you the option to just create a connection to the table, rather than trying to load all the data for you to view in the workbook, if there's a lot of data.
Select 'Add this data to the Data Model', to enable data refreshing in PowerBI.

3. Design your reports using Power BI
You can log into the Power BI public preview online at https://www.powerbi.com.
Go to the Get Data tab to import the data. This gives you several options for the data source, such as GitHub, Dynamics CRM, SendGrid, and Excel, which is the one we want in this case.
With Excel selected, click Connect, browse for the file and then Connect again.
You are taken to the Dashboards area, where you will see an item representing the workbook. Double click on this to to create the report. (Or if you get an error message, as I sometimes did, just open it in the Datasets area).
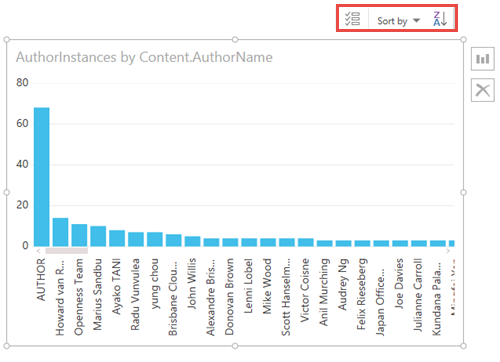
Creating a report is pretty intuitive and straightforward – you select the fields you want to add to any particular visualisation. Unless you click away from the visualisation in the main panel, fields will be added to the same visualisation. To start a new visualisation, just click somewhere else on the main panel.
You can sort the fields in a visualisation by right clicking it.

Once the report is designed, you can add it to the dashboard by clicking the pin icon next to the report.
4. Schedule data refresh
Click the menu next to the data set, and select schedule refresh.

You will need to click Edit next to the label AzureTable to enter the credentials for the table.

Steps using Power BI Designer
Generating reports using Power BI Designer is very similar to generating reports using Excel. I'll just highlight the steps that are different below.
1. Import the data using Power BI Designer
Firstly, if you don't have it, install Power BI Designer.
Click Get Data or New Source and select Microsoft Azure Table Storage.

You will be prompted to enter the name or URL of the storage account.
After this, if you haven't connected to the account before, you'll be prompted for the key.
The tables for the storage account will appear in the Navigator panel.

Select the table(s) you want to use and click Load.
2. Query the data using Power BI Designer
To query and manipulate the data, go to the Query area in Power BI Designer.
This works in exactly the same way as querying data with Power Query in Excel.
When you are happy with the query, go the Power BI Designer's Report area.
3. Design your reports using Power BI Designer
In Power BI Designer's Report area, you can set up visualisations (charts and maps) for the data.
 works in the same way as designing reports in Power BI online.
When you have set up your reports, save the Power BI Designer file (a .pbix file).
4. Import your reports into Power BI
You can log into the Power BI public preview online at https://www.powerbi.com.
Go to the Get Data tab to import the data. This gives you several options for the data source, such as GitHub, Dynamics CRM, SendGrid, Excel and Power BI Designer File, which is the one we want in this case.
With Power BI Designer File selected, click Connect, browse for the file and then Connect again.
You are taken to the Dashboards area, although the reports you designed won't be there yet.
To add them to the dashboard, go to the Reports tab, select a report, hover over it and click the pin icon.

The Dashboard
And there you have it, a shimmying display of your previously dull tabular data.
The example I've used only scratches the surface of the range of charts, maps and widgets available in Power BI. The sample available in Power BI gives you a better idea of the dashboards possible:

Useful links
- Power BI
- The Power BI support site
- M language specifications
- Channel 9 Deep dive into Power Query formula language
- Pathway to Power BI – a YouTube video series by @jenstirrup
- Matt Masson's blog – @mattmasson,is a PM on the Power Query team
Sign up to the Azure Weekly to receive Azure related news and articles direct to your inbox or follow on Twitter: @azureweekly