How to use Power BI deployment pipelines to enable DevOps for analytics

Power BI deployment pipelines is a (relatively) new feature of Power BI that is used to manage collaboration, change management and testing of reports. NOTE: you will need Power BI premium in order to be able to use this feature - in the new "per user" pricing premium is $10 / person / month, and you can also sign up for a free trial if you just want to test out these features.
This new feature allows you to create reports and promote them through your various environments. The DevOps processes that are commonly used in many other areas of professional software development are now available for use within Power BI, and I for one am incredibly excited about it!
The pipelines are designed with three stages: dev, test, and prod.
Similar to when DevOps is applied in other scenarios, the three environments serve different purposes:
- Dev is used for report creation and collaboration on new features
- Test is a more stable environment that is used to share the report with testers and other stakeholders, in order to get feedback and carry out testing
- Prod is your stable production environment, which reports are promoted to once they've been fully tested and approved
Development
The best way to develop a new Power BI report is using Power BI desktop. However, especially when collaborating with others, it can be easy to end up with many versions of the same report, or to get out of sync.
Luckily, Power BI supports integration with SharePoint, which can be used to share a single copy-of-truth for each report.
The first thing that you should do if you are planning on using SharePoint to store your reports, is ensure that you sync the SharePoint site, or folder, that you're planning to use locally. You can do this by going to the SharePoint site online and clicking the "sync" button:
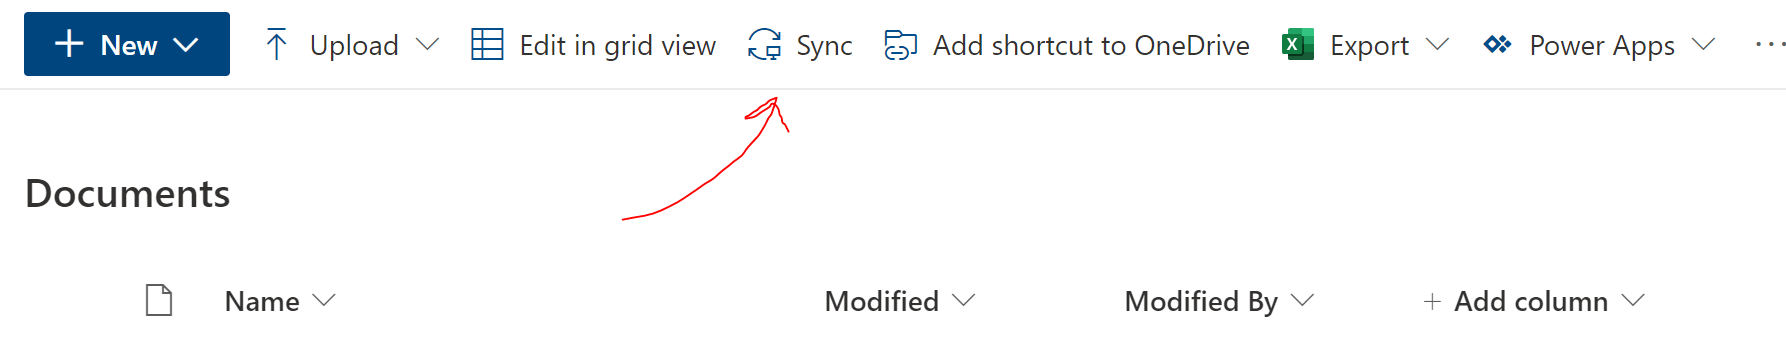
This will open OneDrive on your local machine. Once you log in, the site should sync to your local file storage.
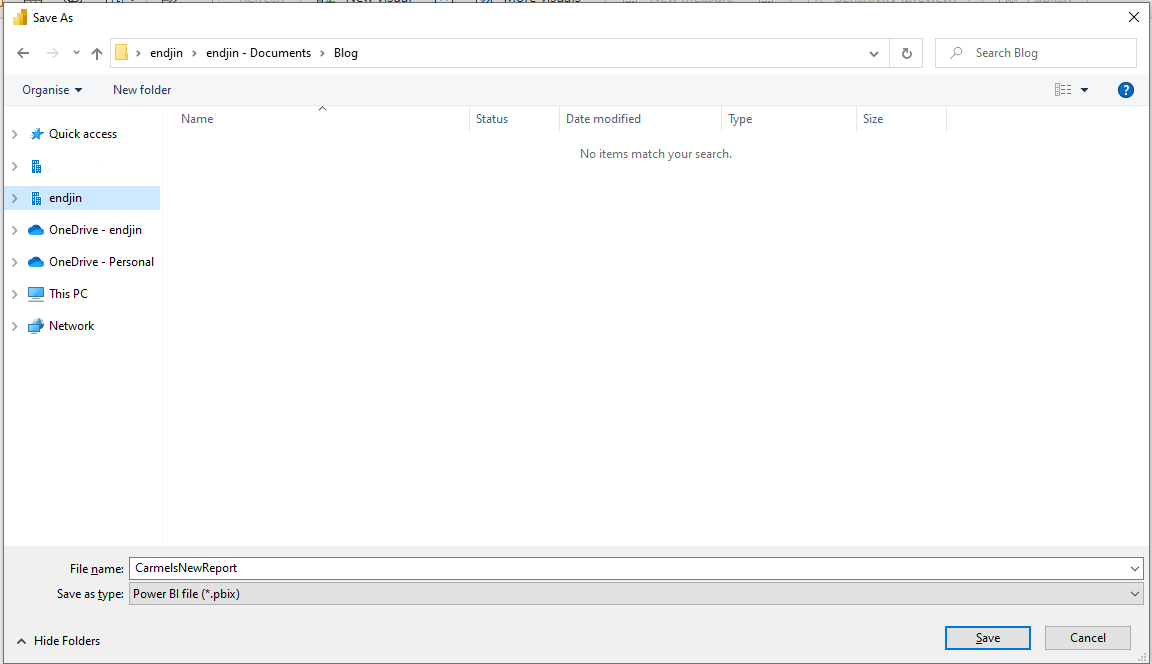
Now, you can open Power BI desktop and save your new report directly into the SharePoint site.
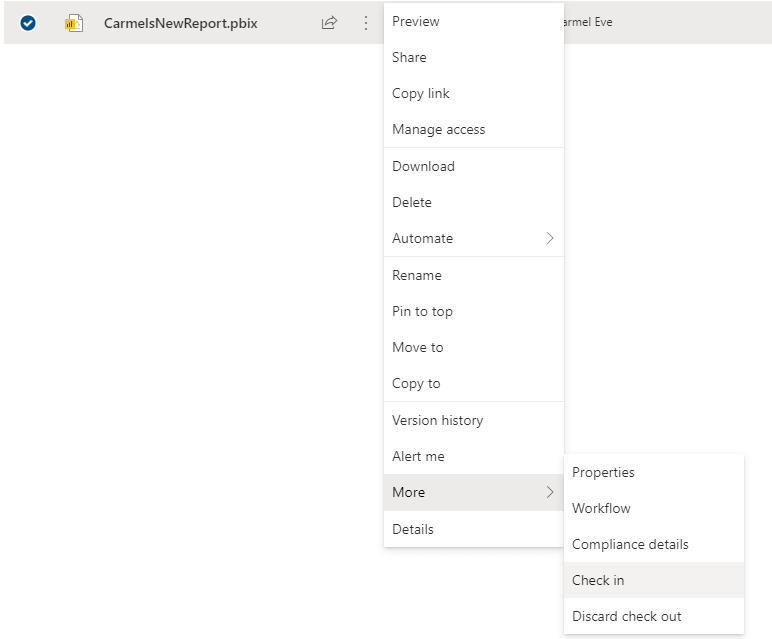
Once it has been uploaded to SharePoint, if viewed in the browser, you can "check out" the report:

This means that only the user that has checked out the file is able to edit. You can do this either in SharePoint online, or from your local version of the files. For Power BI reports, you will need to use the local version, as there is not support for editing reports from within SharePoint.
From Power BI desktop, you can create the first version of your report. As an example, I'll create a sample report, connect to a blob storage account containing a csv, and adding a simple visualisation.

Once you have finished editing, you will need to check the report back in.
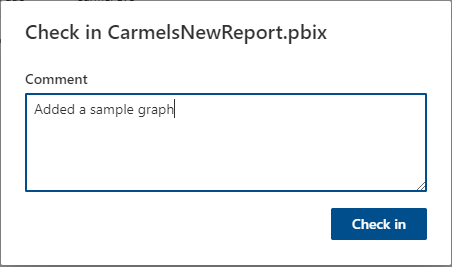
When you check in your changes, you are able to add a commit message:
Creating a workspace
In order to share your report, you will need a workspace in Power BI.
Once you have signed in to Power BI Service, you can create a new workspace by selecting Workspaces > Create a workspace.

You enter a name for your workspace. For now, leave the OneDrive link blank.
Note: You'll need to create the workspace with a premium or embedded capacity in order to be able to use deployment pipelines.
Once your workspace has been created, select "Add Content" > "Files" > "SharePoint - Team Sites", and enter the link to your SharePoint site. This link should be of the form https://{AccountName}.sharepoint.com/{SiteName}. From here, you should be able to navigate to the report that you have created.
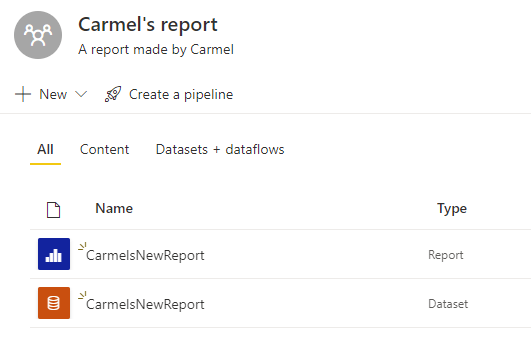
If you select the report, the content will then be added to your Power BI workspace:
If you select the report from within the Power BI service, you'll be able to see the visuals which you added:

Deployment pipelines
If we now go over to the Deployment Pipelines tab, we can create a new pipeline:

And assign the workspace to the pipeline.

Once you've assigned the workspace (to the development environment), you should see the following screen:

From here, once you are happy with the report you've developed, you can promote it to the test environment by clicking the "deploy to test" button. This will create a test version of your workspace:

You can also set up dataset rules which are applied on deployment. To do this, click on the lightning symbol at the top right of the test environment.

In here, you can replace values in your dataset connections, allowing you to connect to different data sources in your test and production environments. If you are updating these settings, you'll likely need to authenticate with the updated dataset, which can be done in the settings for the dataset within the test workspace.
Once deployed to test, we can run a data refresh.

Once the refresh is finished, we are able to view the report from within the newly created test workspace:

The test workspace can then be shared with stakeholders in order to test and validate the report.
Updates
If you receive feedback from the testing which needs to be actioned, you may need to make updates to the report.
To do this, you check out the report file as before, and make the necessary changes. For example, we might be asked to update the colour scheme of our report, which we can do within Power BI desktop:

These changes should then be picked up in Power BI service (this can take a few minutes). Once this happens, Power BI will detect that there are differences between the environments:

And we can deploy these updates to test, and see them reflected in the test workspace:

Publishing an App
Once the report has been fully tested and approved, it can be deployed to production. Again, you'll need to set up any dataset rules and refresh the data.
Once deployed, we can publish an app containing the report. The recommended way to share Power BI reports within your organisation is using a Power BI App. The publish can be done from within the deployment pipeline:

When you publish the app, you will then need to enter a name and description, choose a theme colour, and add a report logo.

If there are multiple reports within your workspace, you can choose which reports are added to the app from the workspace area:

Once published, you can view your new Power BI app:

Finally, you can give other users access to the app from the Permissions tab from the app settings screen:
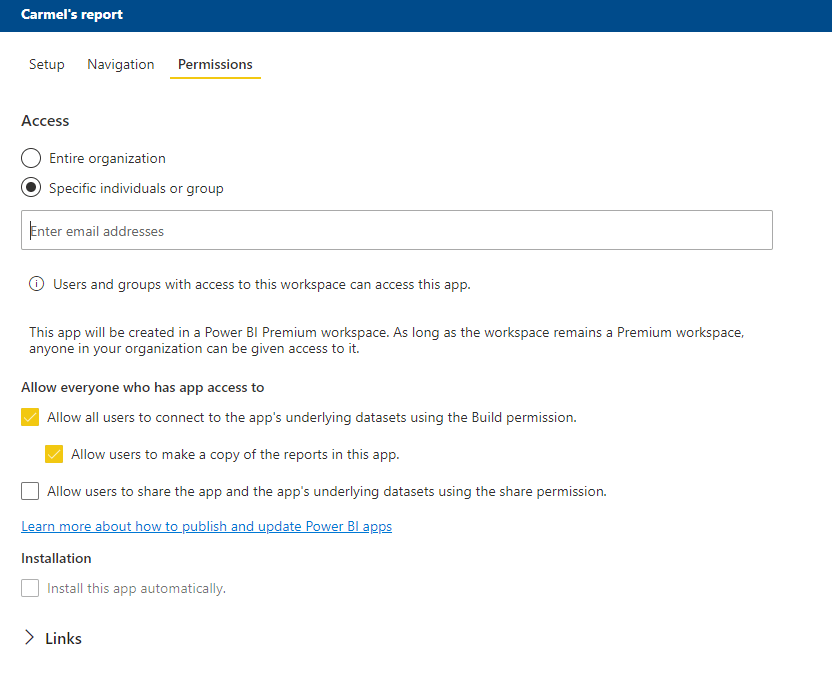
You can give permissions to individual users, but best practice is to manage access via AAD security groups, as this makes management and revoking of access far easier. To do this, create a group within AAD in the Azure portal, and assign that group access within Power BI:

Anyone within thet security group will then be able to view your production application.
And there we have it!
Using Power BI integration with SharePoint, deployment pipelines, and Azure Active Directory, we have a process for developing, testing, publishing, and sharing our reports.
An exciting milestone in the Power BI and analytics DevOps journey!