SQLbits 2022 - The Best Bits

I made the trip by train from Scotland to London two weeks ago to attend SQLbits 2022. SQLbits is the largest expert led data conference in Europe and was being held at the London ExCeL.
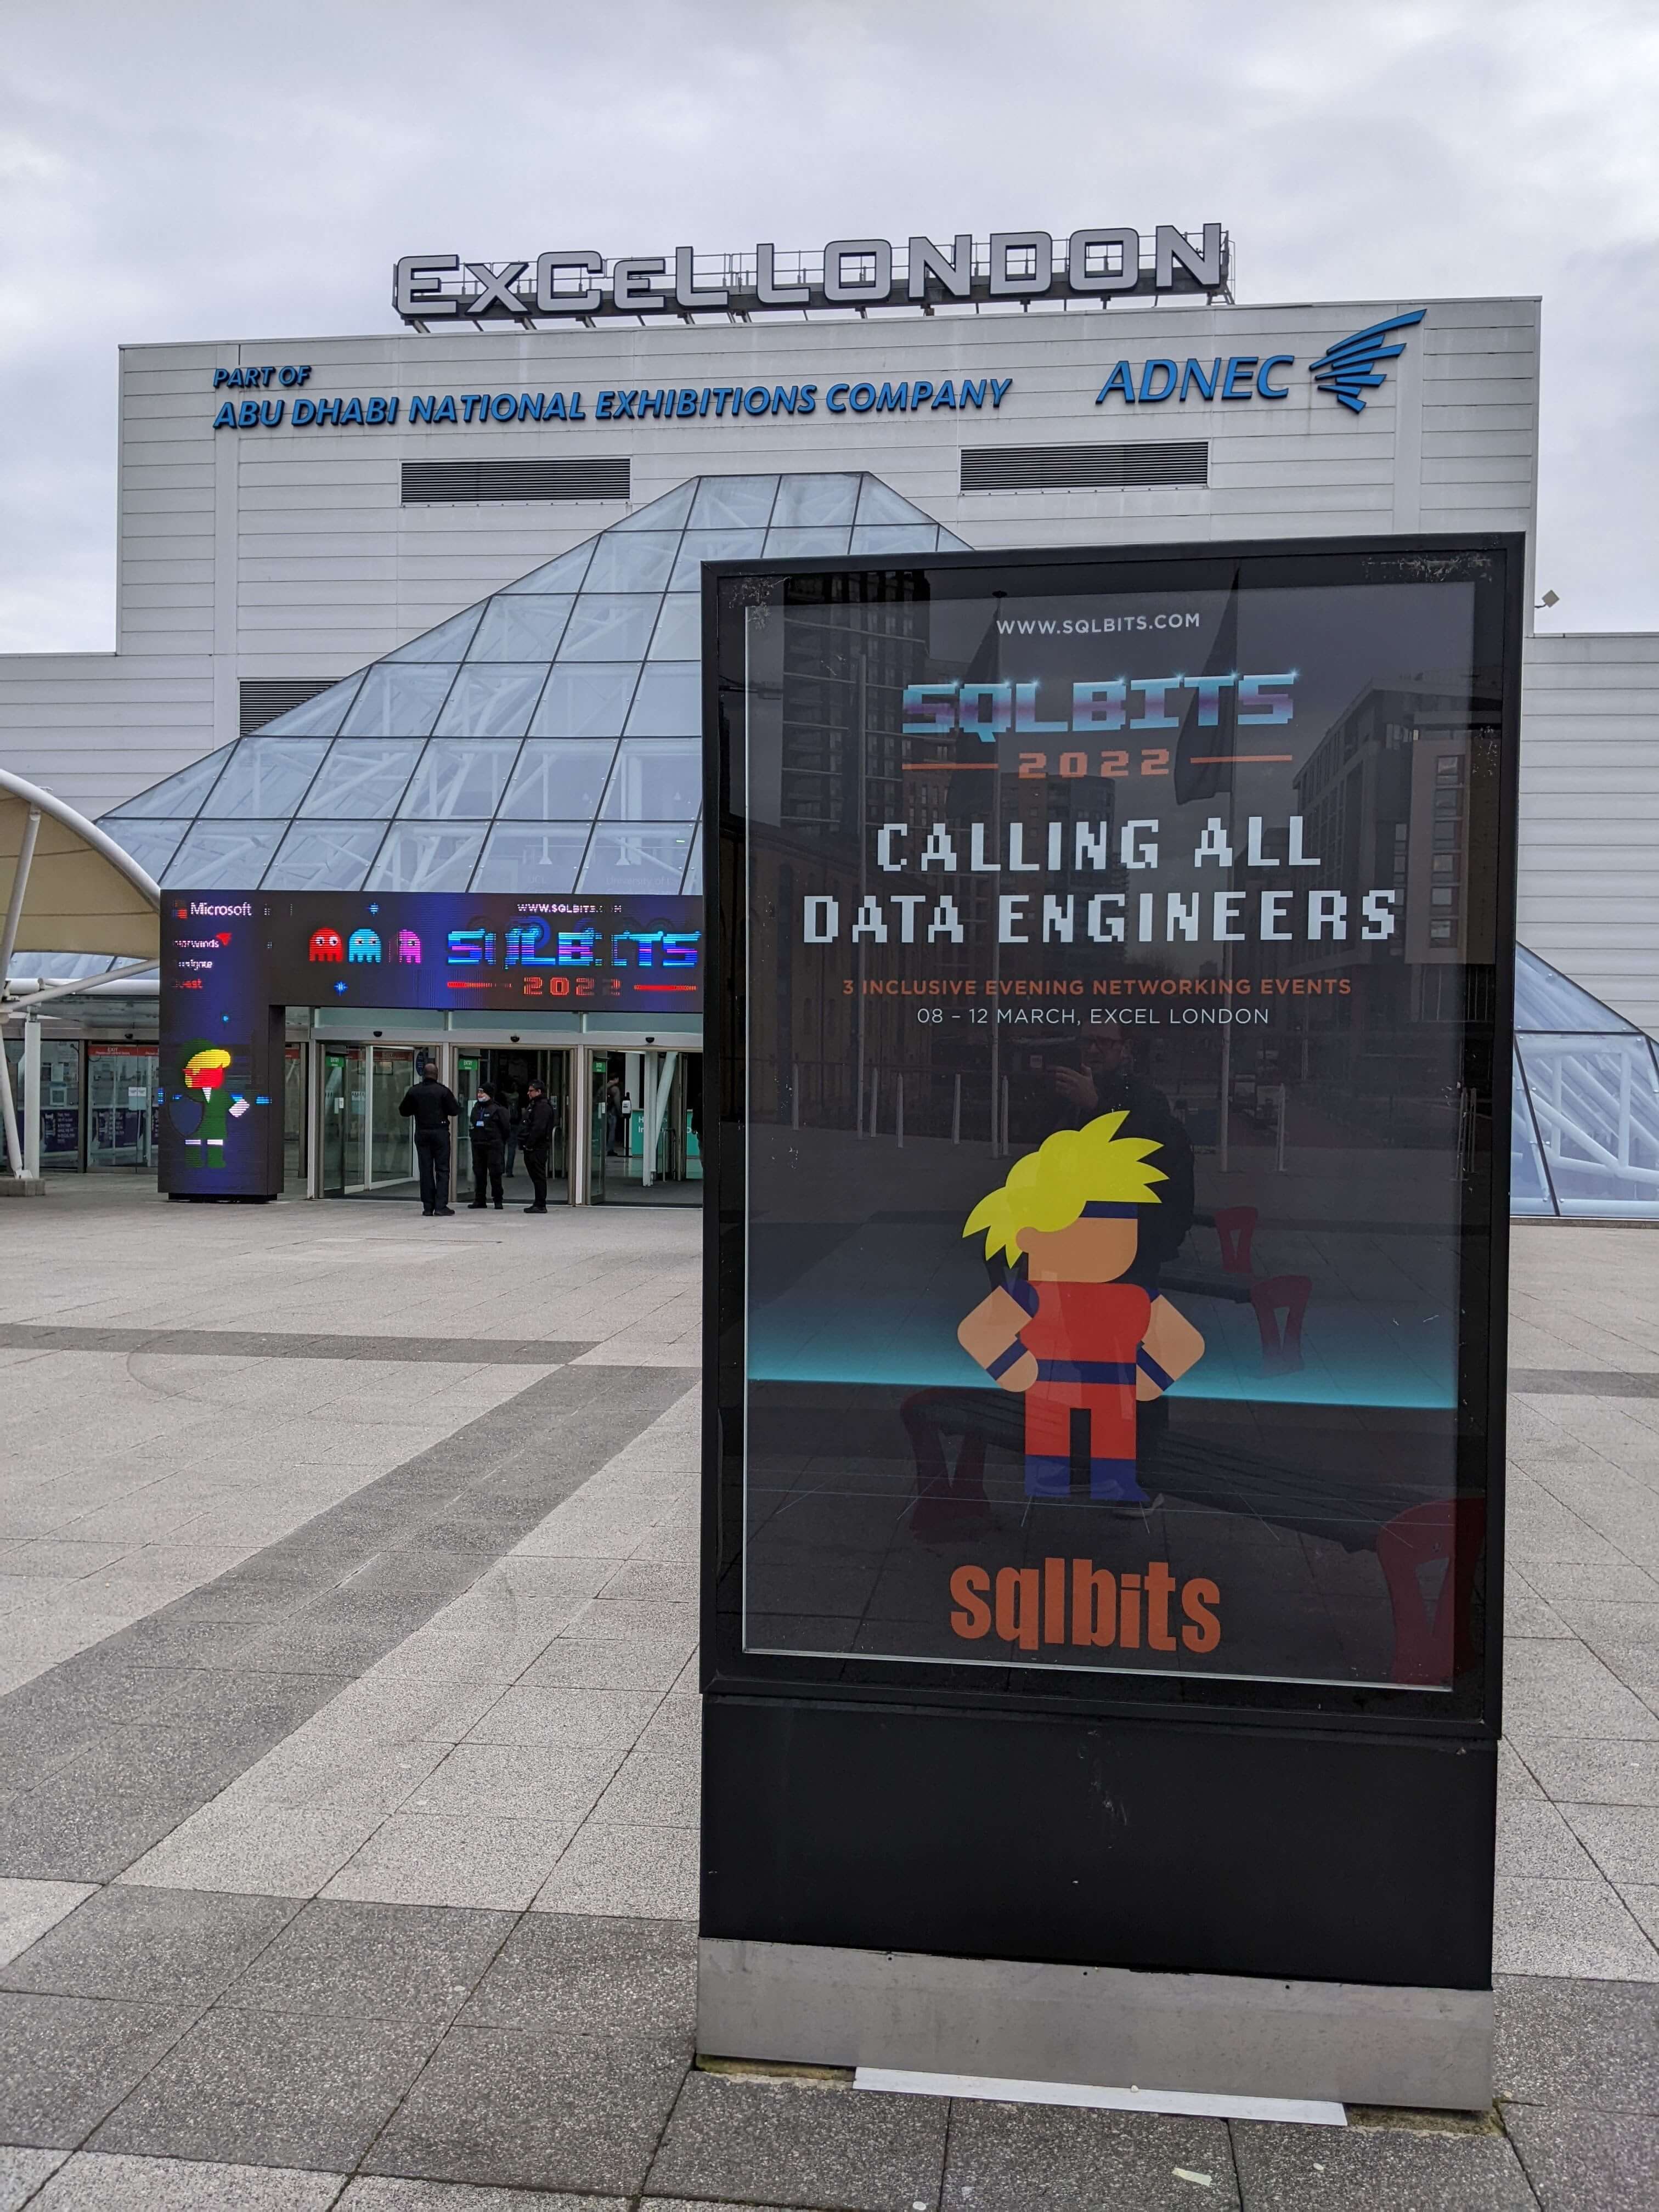
The theme this year was retro gaming. It was great to see imagery from classic games such as PacMac and Space Invaders used as branding around the venue.
This blog captures the highlights from the sessions I attended.
Why star schema is your best choice in Power BI
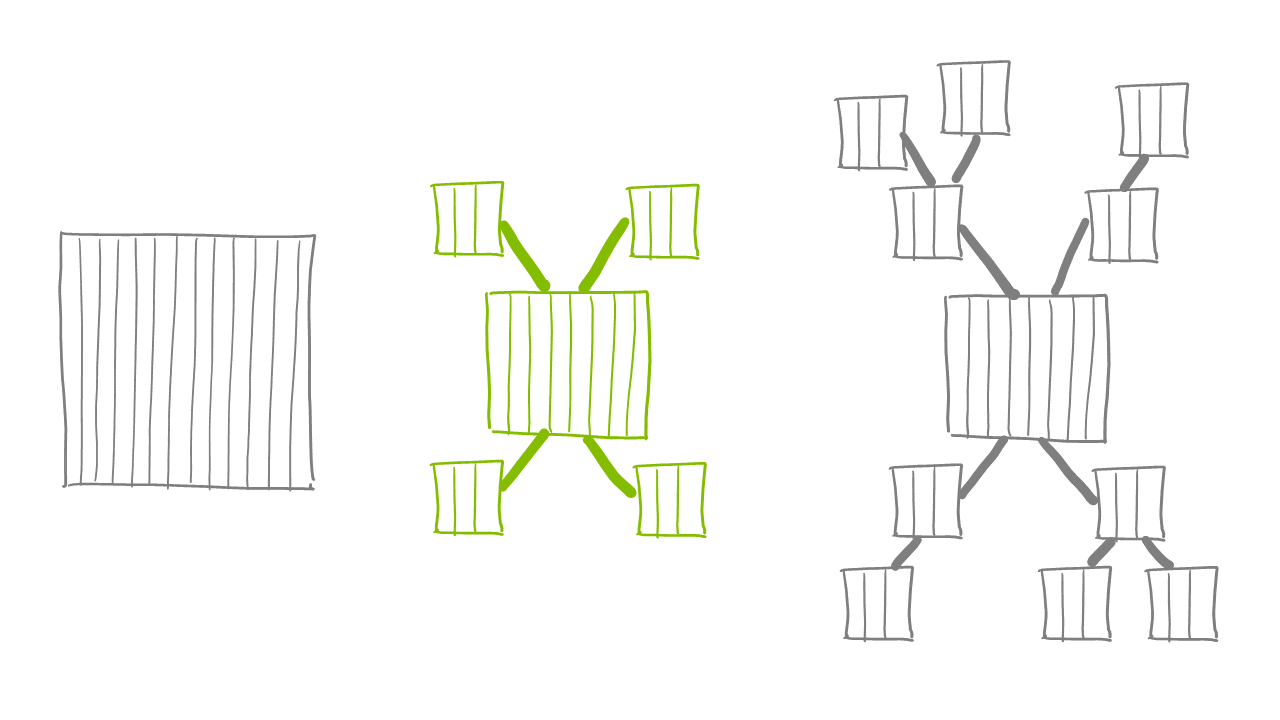
In this session Alberto Ferrari of sqlbi explored three different approaches that can be taken to construct data models in Power BI:
- Single large flat table - also known as the "Excel way" because it is how you would organise data to enable pivot table analysis in Excel.
- Star schema - strict application of Kimble principles: one central fact table, with a number of dimension tables related to it.
- Snowflake - allowing more than one layer of dimension tables.
Alberto had done detailed research based on modelling the same dataset using these three different approaches and weighing up the pros and cons of each option. He considered the following factors using tools such as DAX Studio and the performance analyser built into Power BI to provide quantified evidence:
- Size of the Power BI model driven by how the Vertipac engine is able to load the data into the model.
- Performance of Power BI reports when actions such as choosing slicers were applied.
- The Total Cost of Ownership (TCO) related to developing and maintaining Power BI measures.
- Ease of use of model by end users in building reports.
As one would expect, the star schema came out in top in all areas. For more details, please read Alberto's excellent blog on this topic.
It was great to see that the Kimble principles that I first applied to create traditional data warehouses almost 20 years ago are still relevant today!
How to run a successful AI project
In this 20 minute lightening talk, Robin Lester of Microsoft gave us the benefit of his experience helping a range of different Microsoft partners and their clients to apply Artificial Intelligence.
The following elements resonated with me in particular:
The need to have a clearly defined goal that you are seeking to achieve. This absolutely key to any data and analytics problem and something that James Broome recently talked about in depth.
AI projects are inherently experimental in nature - this is built into the data science practices that are used to deliver AI projects. See blogs Machine Learning - the process is the science and Machine Learning - mad science or a pragmatic process? for further insight. Therefore, stakeholders need to be aware that the project may not be able to find a solution to the goal - for example, machine learning models cannot always be trained to achieve sufficient efficacy to enable them to be used in production. So all AI projects should set expectations accordingly: that they may fail to achieve their objective. The trick here is to "fail fast" wherever possible.
A significant proportion of any AI project effort is involved in data wrangling. It is not unusual to see 80% (or more!) of the effort being consumed with ingesting, cleaning and shaping data to make it suitable for use.
You don't necessarily need to build your own solutions from scratch. Microsoft offers a range of world class pre-trained models such as Text Analytics, which just one of a suite of Cognitive Services available to use. Wherever possible you should try these solutions first before choosing to invest in building a custom model.
A major factor in any AI project is not the data or the technology, but the people who need to be involved in making it a success. Do not under-estimate the resistance that you may encounter along the way. Ensure that you take the time to engage stakeholders who may be sceptical, feel threatened or simply be anxious about what the project may mean for them.
Finally, I was really pleased to see that Robin place ethics as a prime consideration. This includes the ability to explain the outcome of a model, which is a requirement under GDPR. He flagged Microsoft's InterpretML an open-source toolkit that helps to achieve model explainability.
One thing I was not aware of was the forthcoming EU AI Act which will be the first set of laws to govern AI by a major regulator. This definitely merits further research as it places explicit expectations on companies using AI.
Power BI Charticulator
We have recently started to experiment with Charticulator. So this session really jumped out. I wasn't disappointed.
Laura GB (Graham-Brown), Solutions Architect at HSO, provided an entertaining, high energy talk showing us how to approach building Charticulator visuals in Power BI from first principals. Based on her experience with the tool, she was able to provide helpful shortcuts and hightlight a few gotchas along the way.
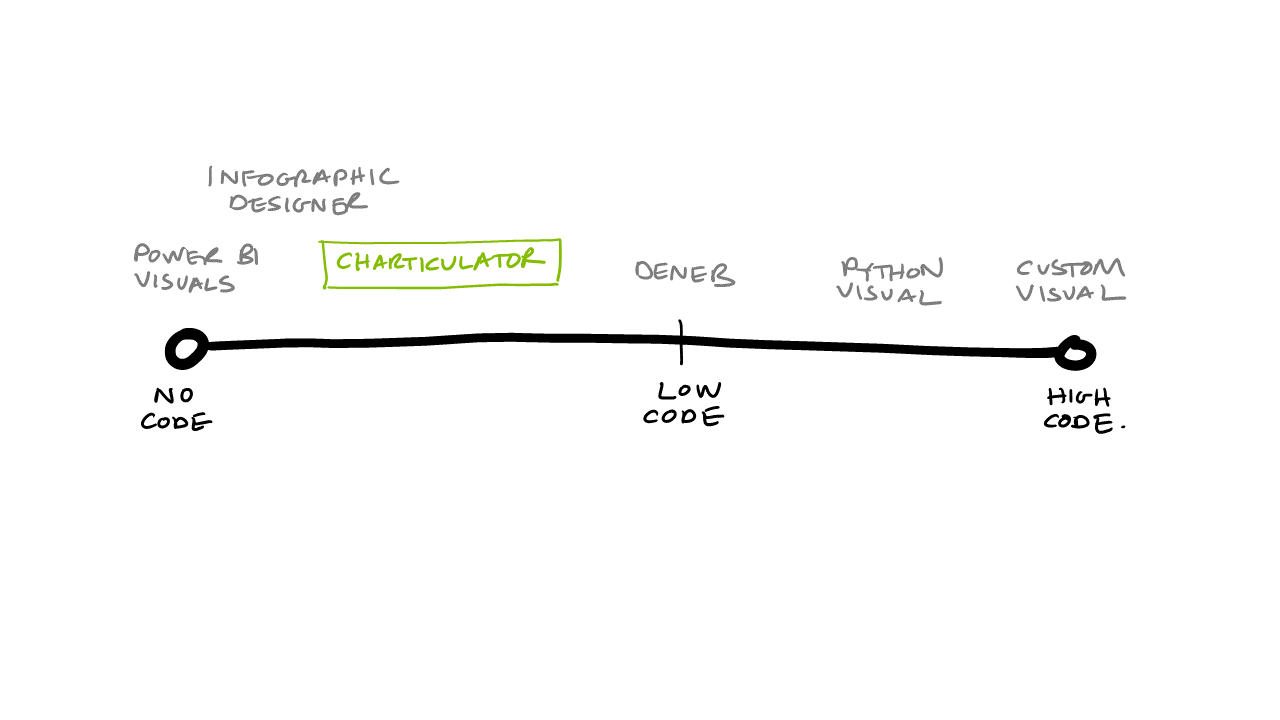
This is something we will continue to experiment with at endjin as we see real potential in this when the native visuals provided by Power BI (or available in the visual marketplace) aren't sufficient. It was also encouraging to hear that Microsoft are actively developing Charticulator, so it will be interesting to see how it continues to evolve.
Talk data to me
Sarah Francis, Product Lead at YouGov, gave a thought provoking talk about how to tell data stories to non-technical audiences.
She delivered some great advice that I noted through the session:
- "You can have the most interesting numbers in the world, but still put the audience to sleep [because of the way that you present the information]"
- "Know your audience, understand their motivations tailor your report accordingly"
- "Beautiful reports that don't lead to decisions or actions are pointless"
- "It's all about story telling, a narrative flow needs to 'join the dots' by linking all of the visual elements together"
- "Skip to the end, get to the point, you can always add the detail later if you are asked questions"
- "Less is more, apply ruthless editing to use the minimum number of visuals by focusing on what is relevant to your audience"
- "Get the basics right with charts and visuals: keep it simple, use contrasting accessible colours, apply clear labels. There is a difference between how beautiful something looks and how well it is communicating the information"
- "You shouldn't have to explain your numbers, it should be obvious from the visuals you are using"
- "Rehearse. Test your data story on somebody else. You can never over prepare!"
All great advice that I often forget to apply consistently!
Enabling teams with Power BI
Patrick LeBlanc and Mohammad Ali from Microsoft gave us a tour of the latest Power BI features that have been recently released, or are imminent.
We were reminded of the Power BI mission statement, to empower every individual and every team with data driven insights. The session was focused specifically on empowering teams, with new features intended to drive collaboration and collective decision making around data.
For example Power BI can now be embedded in Teams to facilitate collaboration, but we should anticipate the integration with Office to go further, for example:
- "Visualise in Power BI" will accompany "Export to Excel" in all Microsoft tools.
- The ability to embed live interactive Power BI reports in PowerPoint will be released in May. No more need to screen snip and paste static screen shots into presentations every month! Simply open up the PowerPoint deck and the latest data will be visible in the slides.
- Excel - can create a pivot table from Power BI datasets. This has been enhanced so that you can now choose how you want to summarize numerical data in the pivot table without having to implement explicit measures in Power BI.
- Power BI wil be shipped as part of Office - it will become both a creator application and a view application so it is consistent with all other Office applications. The objective is to make Power BI as ubiquitous as Excel empowering a new generation of citizen data analysts in every organisation.
- Every office application will soon have a "left rail" (what has also been coined a "meta OS") that will help you to switch to the tool that is best suited to that task. For example, if you want to build a chart in PowerPoint or Excel, Power BI will be the tool launched to support this.
Another major new addition to Power BI is Goals, an enterprise scale KPI/OKR framework. It is intended to become the de facto way to drive a data culture in your organisation. It works by adding a layer on top of your existing Power BI reports to standardise how people set and track performance against data driven goals. You are able to tag people who are responsible for achieving the goal and to collaborate around the goal.
It is extremely simple to set up a new goal. If the data is surfaced in an existing Power BI report, you simply click on it to select it as the basis for a new goal. Power BI will then link to and snapshot this data point at the defined interval (for example every day), allowing you track actual against target. You can set up rules to drive the status of the goal, for example to implement a RAG (red, amber, green) status.
Goals can also be set up to implement enterprise wide scorecards that will cascade and branch to reflect the goals and data relevant to the specific department that a user belongs to.
The final significant development in the pipeline is the ability to version control and enable co-authoring of Power BI reports.
Spring clean your data lake with Database Templates for Synapse Analytics
Vanessa Araújo a Data Solution Architect at Microsoft provided a lightening talk overview of the new Database Templates for Synapse Analytics.
Data lakes have enabled organisations to respond to data velocity, veracity and variety. But the information that data lakes hold can often be difficult to navigate and to put into use by end users, thus limiting the value that organisations can gain from it. I was reminded immediately of the saying "data rich, information poor".
Vanessa drew parallels with the London Tube map which provides an easy way for people to navigate the transport system. Database Templates will perform a similar role for data lakes with a view to achieving the following objectives:
- Providing a navigation system for your data lake.
- Break down data silos - by giving citizen analysts across your organisation access to curated information in the lake.
- Democratising understanding of the information to enable "insights for all".
- Maximising value for the organisation.
Database Templates is integrated into the Synapse Analytics unified experience, giving you the tools you need to perform analytics in once place. It currently supports delimited and parquet, Microsoft are currently working on support for delta. A set of industry models are provided that you can use as a quick start to create a template. These are intended to get you 80% of the way there, with the expectation that will need to edit the template to tailor it your organisation. Templates can also be inferred from files in a target folder in the lake.
A template is meta data. It contains a business friendly description of the data, a dictionary of the fields, relationships between entities and how the data should be stored in lake. For example, defining the columns to be used to drive partitions.
Templates are stored in Git as JSON files alongside all other Synapse artefacts. So this enables them to be a first class citizen in your Azure DevOps deployment pipelines. It also opens up opportunities to share the templates across the enterprise through Git integrations.
The exciting part is what the templates enable:
- They define the target schema as a sink in mapping operations within Synapse.
- Power BI Synapse workspace connector understands the model, including the relationships between entities.
- Integration with Purview for discoverability.
This is really exciting development and we are looking forward to putting it into use!
Machine Learning on Azure Synapse
Terry McCann, Director of AI at Advancing Analytics, provided a whistle stop tour of various options available to support machine learning on Synapse.
Some of this is supported by "extending onto other applications". For example connecting to an instance of the Azure Machine Learning service.
Terry demonstrated AutoML. Which can generate good results, but you still need to aware of how best to prepare data in order to get the most of this approach. In other words, it doesn't avoid the need to have data science skills but it can be a way of accelerating time to value.
A key piece of advice was to avoid using Spark ML unless you need the power of distributed processing. Wherever possible, you should adopt a single node architecture as it will be easier to train and maintain your model.
Architectural blueprints for the Modern Data Warehouse
Just Blindbæk, Microsoft BI MVP, provided an overview of three architectural blueprints to consider when building business intelligence solutions using modern cloud platforms.
I was struck by how similar Just's thinking aligns to endjin's modern data platform (MDP) blueprints. In particular two recommendations:
For larger scale projects, the use of notebooks running in Synapse Spark Pool for the data transformation, persisting data in the data lake and generating views over the lake using SQL Serverless serve up data for reporting in Power BI. Based on "pay per use" nature of these technologies, we would certainly back up Just's experience of this representing an order of magnitude more cost effective to run.
For simpler use cases, the option to use Power BI as an end to end solution. For example, using Power BI DataFlows for ingestion, under a "bring your own lake" philosophy. This type of use case can be delivered with Power BI pro licenses alone.
Microsoft have the development teams for Power BI and Synapse working closely together. So Just is anticipating further capabilities to be opened up in the future.
Purview
I attended 3 sessions which were focused on Purview. What struck me in all of these sessions was a lot of reference to Purview in the future tense - i.e. what it was going to be able to do in the future. There is a huge amount of excitement about this product, because the industry has been crying out for something like this for a long time. Microsoft are clearly committed to it as a strategic product, and it feels like it is getting towards that tipping point where the features and the number of data sources it supports will justify the cost of spinning up this service.
What I learned is that Purview is an implementation of the open source Apache Atlas, a scalable and extensible set of core foundational governance services
Summing up
I found the two days to be full of useful information. It is clear that the Microsoft data and analytics ecosystem is highly capable and continues to evolve at pace, with a bold vision and exciting new developments constantly being released.
The event was really well organised, and built a strong sense of community. Though more informal events such as the pub quiz, you were given ample opportunities to network with peers. I didn't realise how much I have missed "face to face" meetings over the last few years and the random opportunities that "in person" events create to meet new people and make professional connections.
Thanks SQLbits, I will definitely see you next year!