Table Functions in DAX: FILTER and ALL


What are table functions?
Table functions are functions in DAX that return a table. These are virtual tables inside of Power BI that are created using DAX functions, rather than tables that are physically within the data model. This blog post will explore two of the most common table functions – FILTER and ALL.
FILTER
The FILTER table function is useful if you want to filter a table. The FILTER function returns a sub-set of a table. To use the FILTER function, you first specify a table name, followed by a condition. The condition is evaluated row by row on top the specified table and only the rows satisfying the condition will be returned as a result. So, the FILTER function acts as both a table function and an iterator.
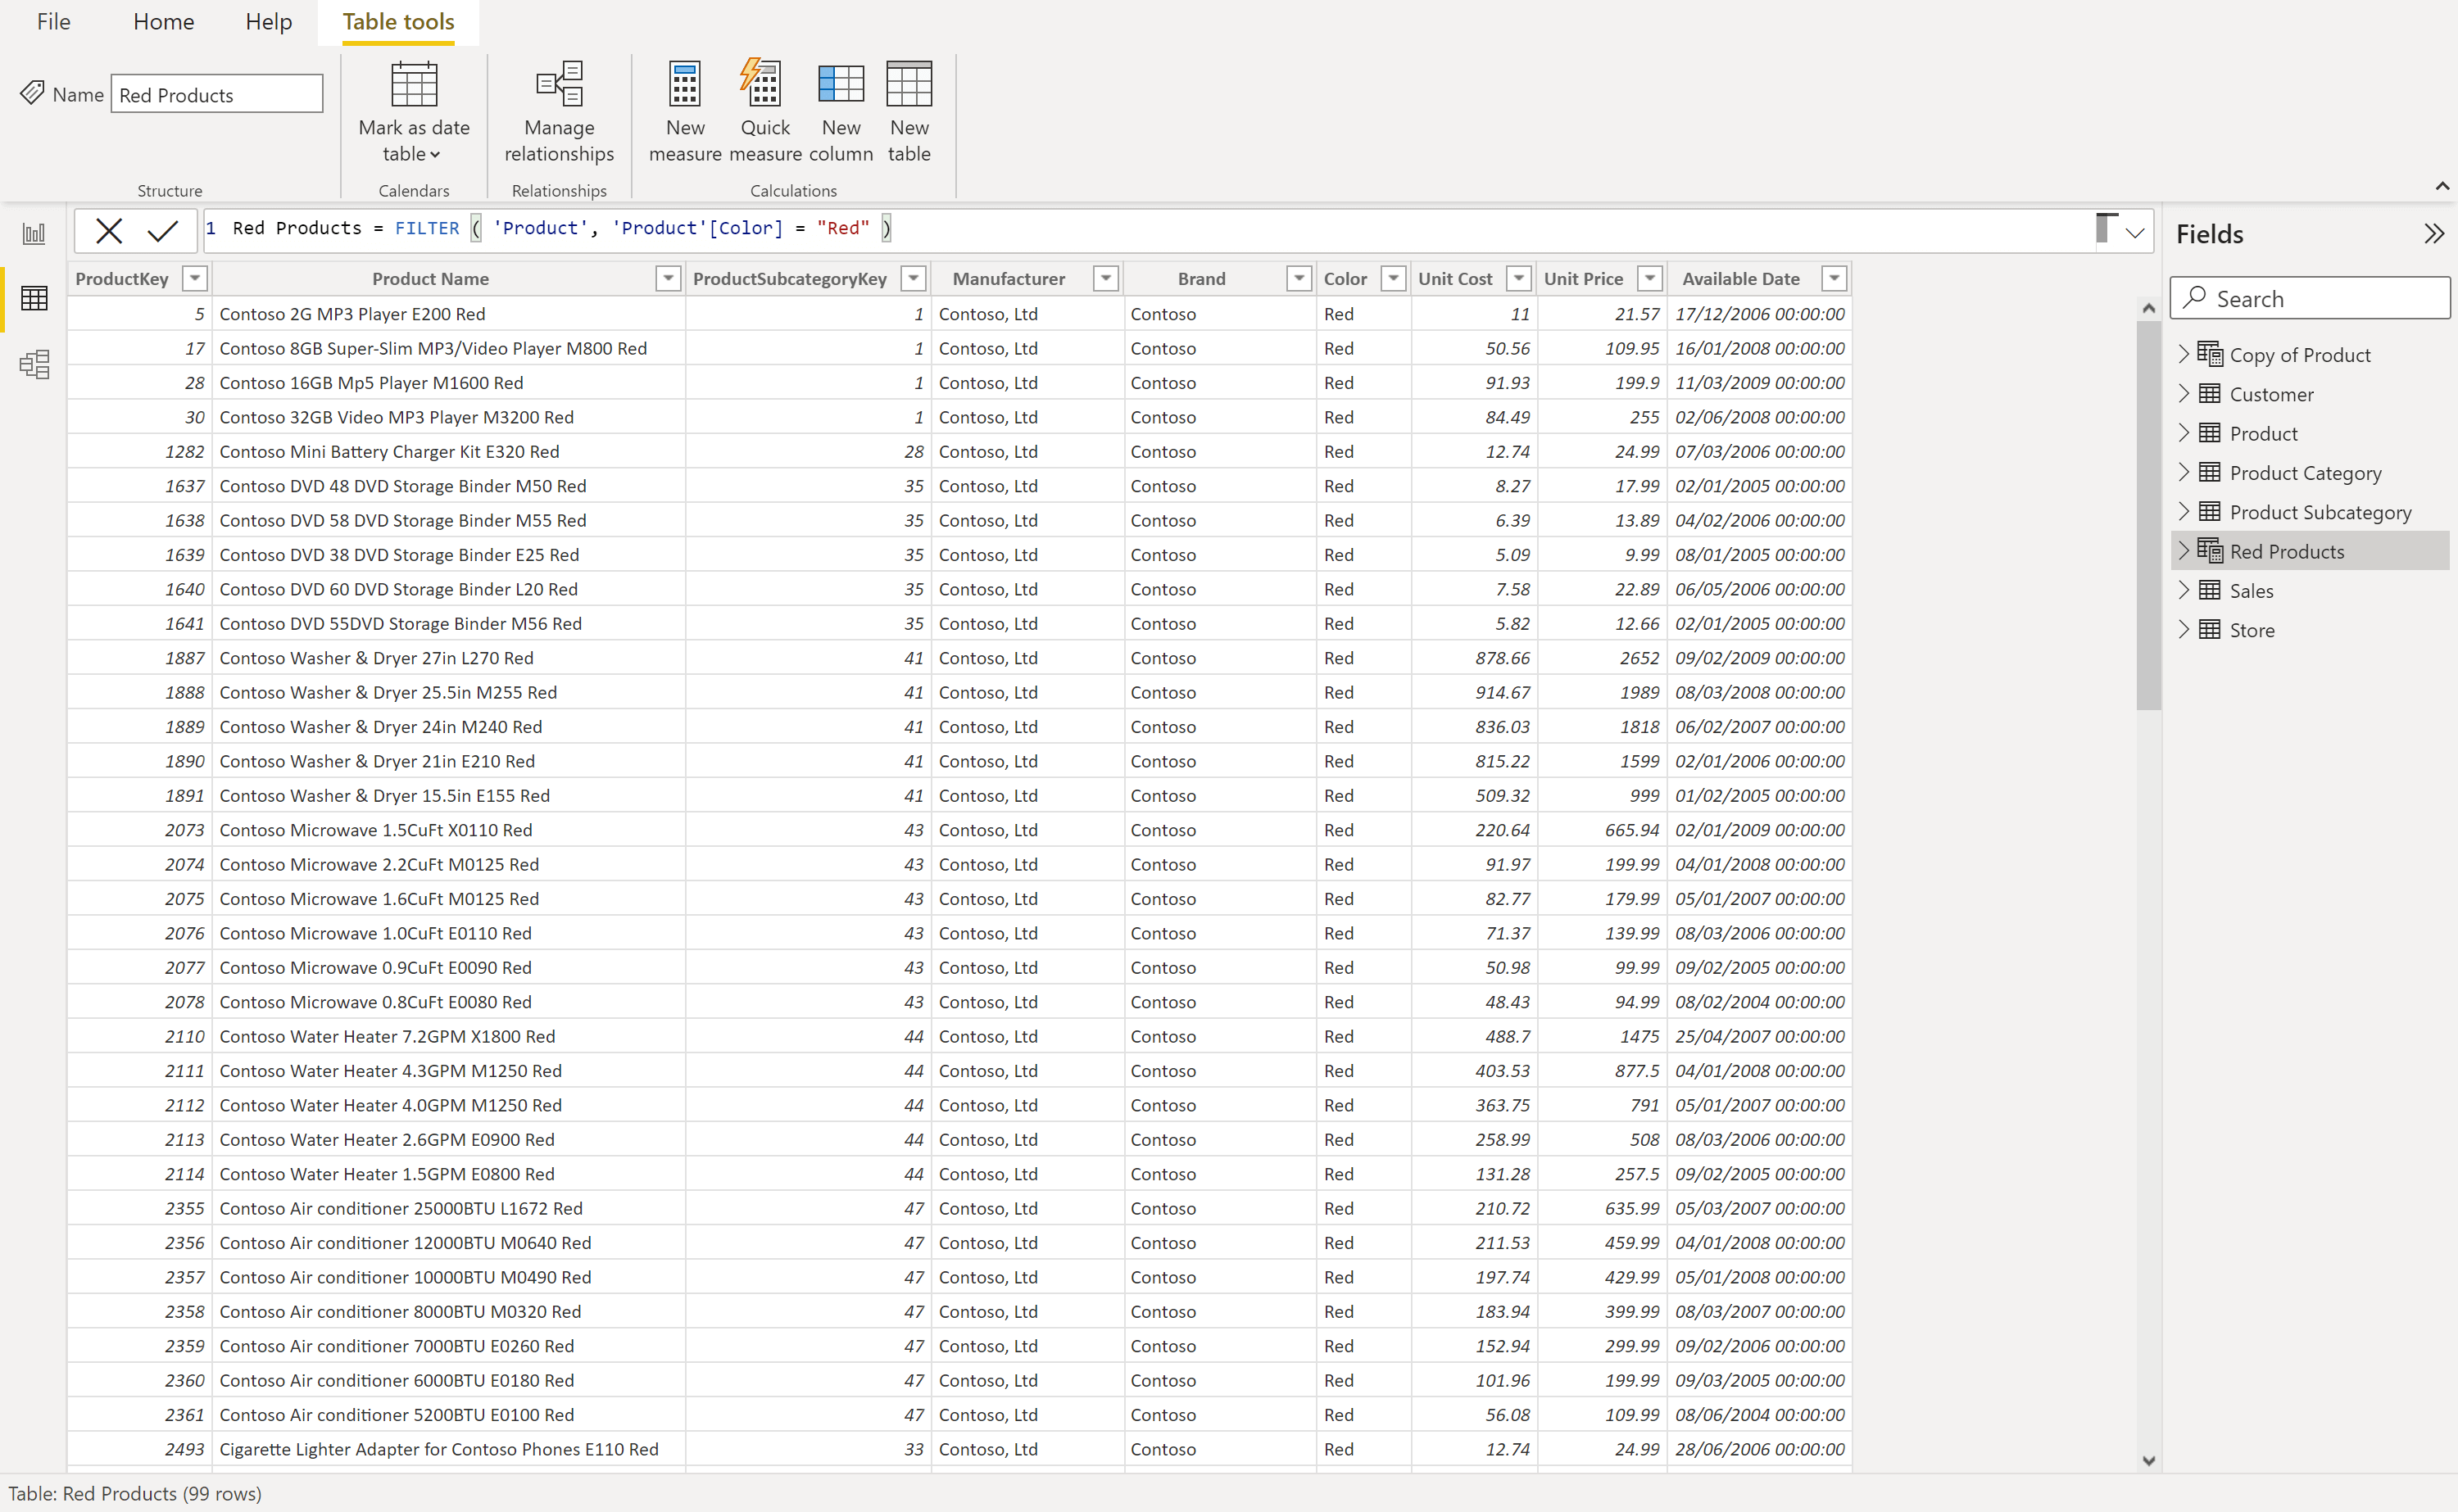
In order to illustrate how the FILTER function works, we will create a new calculated table that is filtered to only return products from the 'Product' table with a colour of red.
Red Products = FILTER ('Product', 'Product'[Colour] = “Red”)
Here, the FILTER function will evaluate every single row of the 'Product' table. For each row, if the 'Colour' column has a value of 'Red', this row will be included in the new calculated table as shown below.
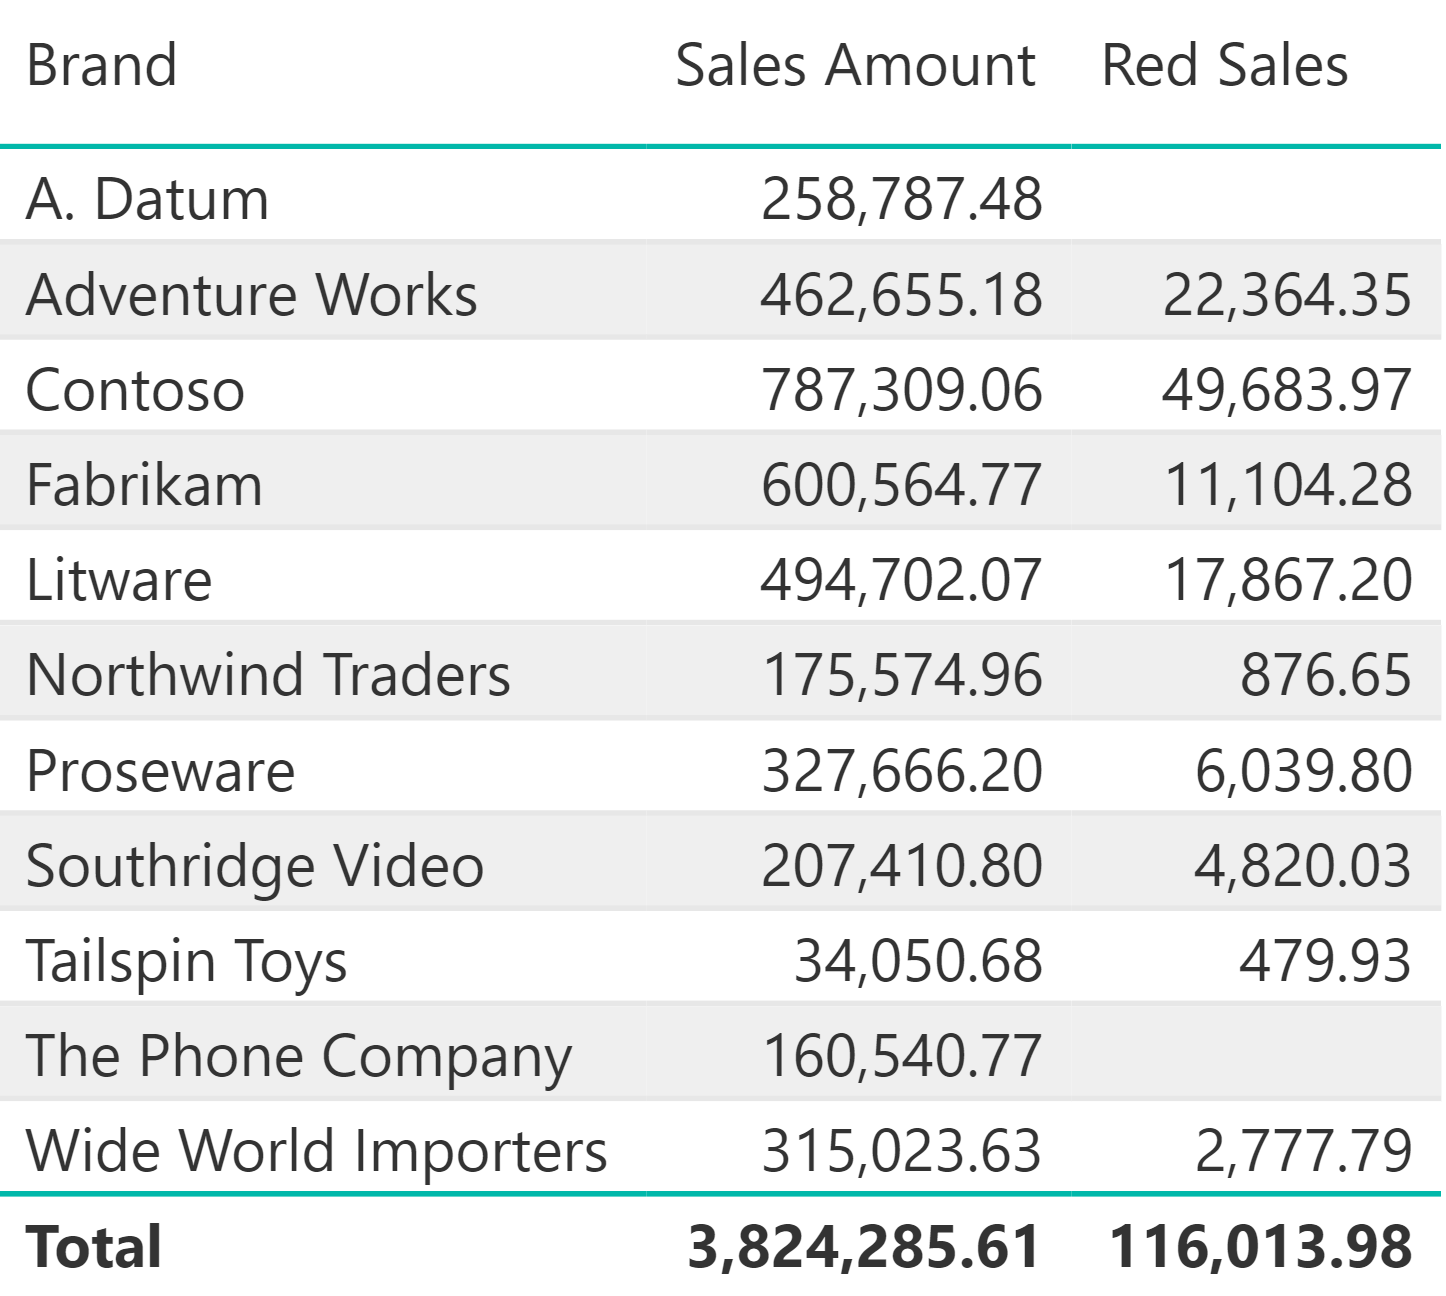
Whilst this example illustrates how the FITLER function operates, in practice, you typically want to use a table function to create a temporary table that is scanned and iterated by some other function. In other words, FILTER is useful when you want to return the result of a calculation which is done over a subset of values from a table. For example, we can create a measure that uses FILTER to show only the sales of products which are red.
Red Sales =
SUMX (
    FILTER (
        Sales,
        RELATED ( 'Product'[Colour] ) = "Red"
    ),
    Sales[Quantity] * Sales[Net Price]
)
Here, FILTER is working on the 'Sales' table, but the 'Sales' table does not contain the product colour, so we want to use the function RELATED. RELATED gives you access to columns from other tables that have a relationship with the current table you are scanning.
For each sale in the 'Sales' table, the RELATED function looks up the 'Colour' value in the 'Product' table. The result of this lookup is used by the FILTER function to identify and return rows where the 'Colour' column has a value of 'Red'. This temporary table is then scanned and iterated by SUMX to calculate the Sales[Quantity] * Sales[Price] for each row in the table. This computation calculates the sales amount for only red products.
This new Red Sales measure has been added to the table below to create a new column which shows the red sales for different brands.
ALL
Now, we shall explore the next table function in this blog post - ALL. ALL returns all the rows in a table, or all the values in a column, ignoring any filters that may have been applied.
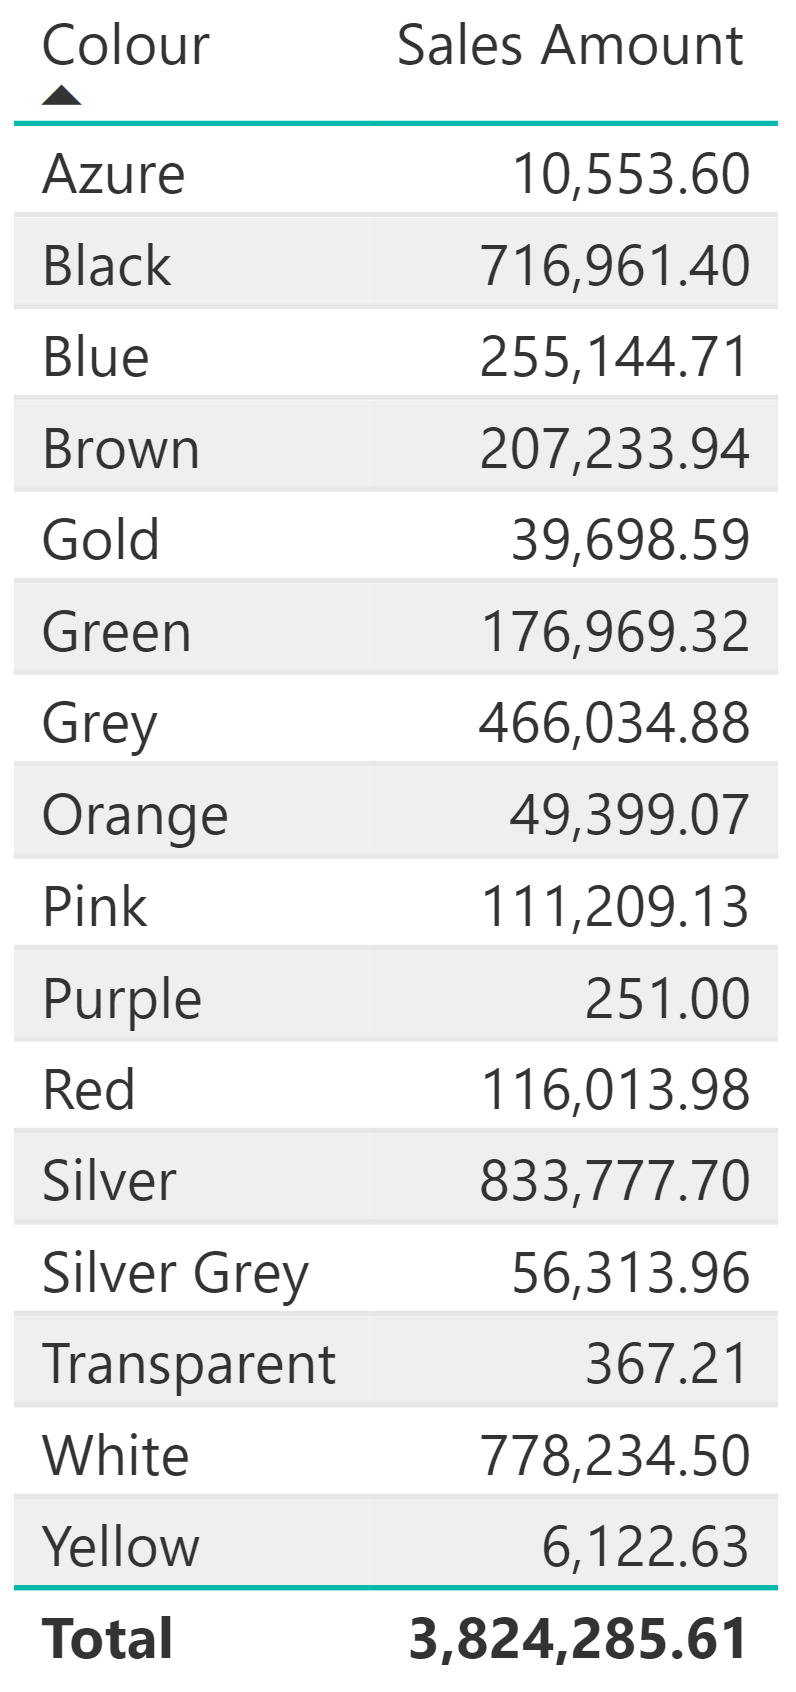
In the table below, we have the colour of each product and we have the sales amount which has been calculated via the following measure:
Sales Amount = Sales[Quantity] * Sales[Net Price]
ALL is useful if you want to compute percentages and ratios. If I want to see the percentage of red sales against all of the product sales I will need to compute the denominator of this ratio – the grand total of all the sales. We can do this using a new measure:
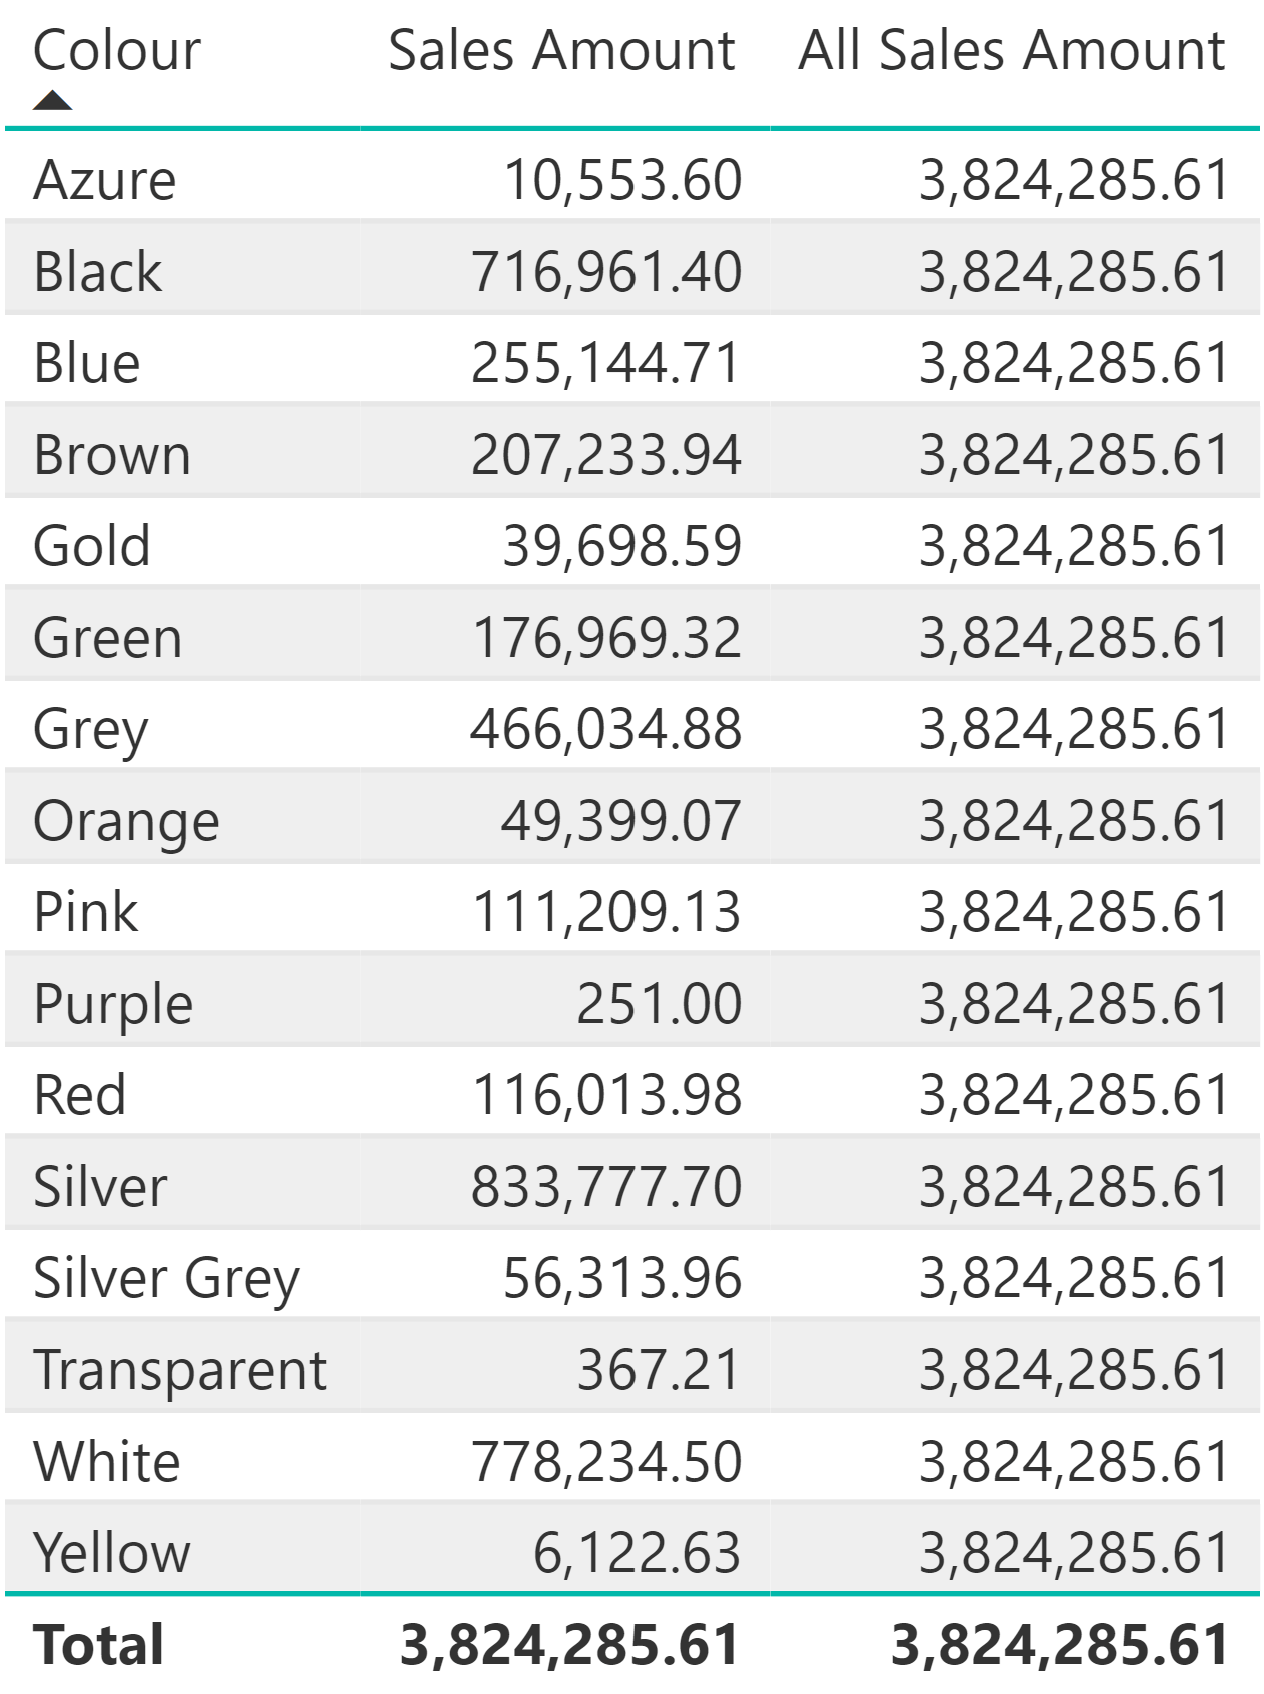
All Sales Amount = SUMX ( ALL ( Sales ), Sales[Quantity] * Sales[Net Price])
Here, SUMX requires the result of ALL Sales. ALL ignores any filter that is applied in the report and returns all of the sales. SUMX iterates over the whole table computing Quantity multiplied by Net Price, even if there are filters in place (such as the filter of 'Colour' in the example below). Whenever you use ALL, any filter gets removed and you always compute the same number for all of the cells, as we can see in the table below.
Now we have the denominator All Sales Amount, we can remove this measure from our table and create our percentage sales amount calculation:
Sales % = [Sales Amount] / [All Sales Amount]
The Sales % measure can be added into the table as a new column which displays the percentage of sales of each colour over the grand total of sales.

Conclusion
In this blog post we have seen how the FILTER table function can be used to filter a table and is useful when you want to return the result of a calculation over a subset of values. We have also seen how the ALL table function can be used to return all rows of a table or values of a column, ignoring any filters applied and is useful when computing percentages and ratios.