Notebooks in Azure Databricks

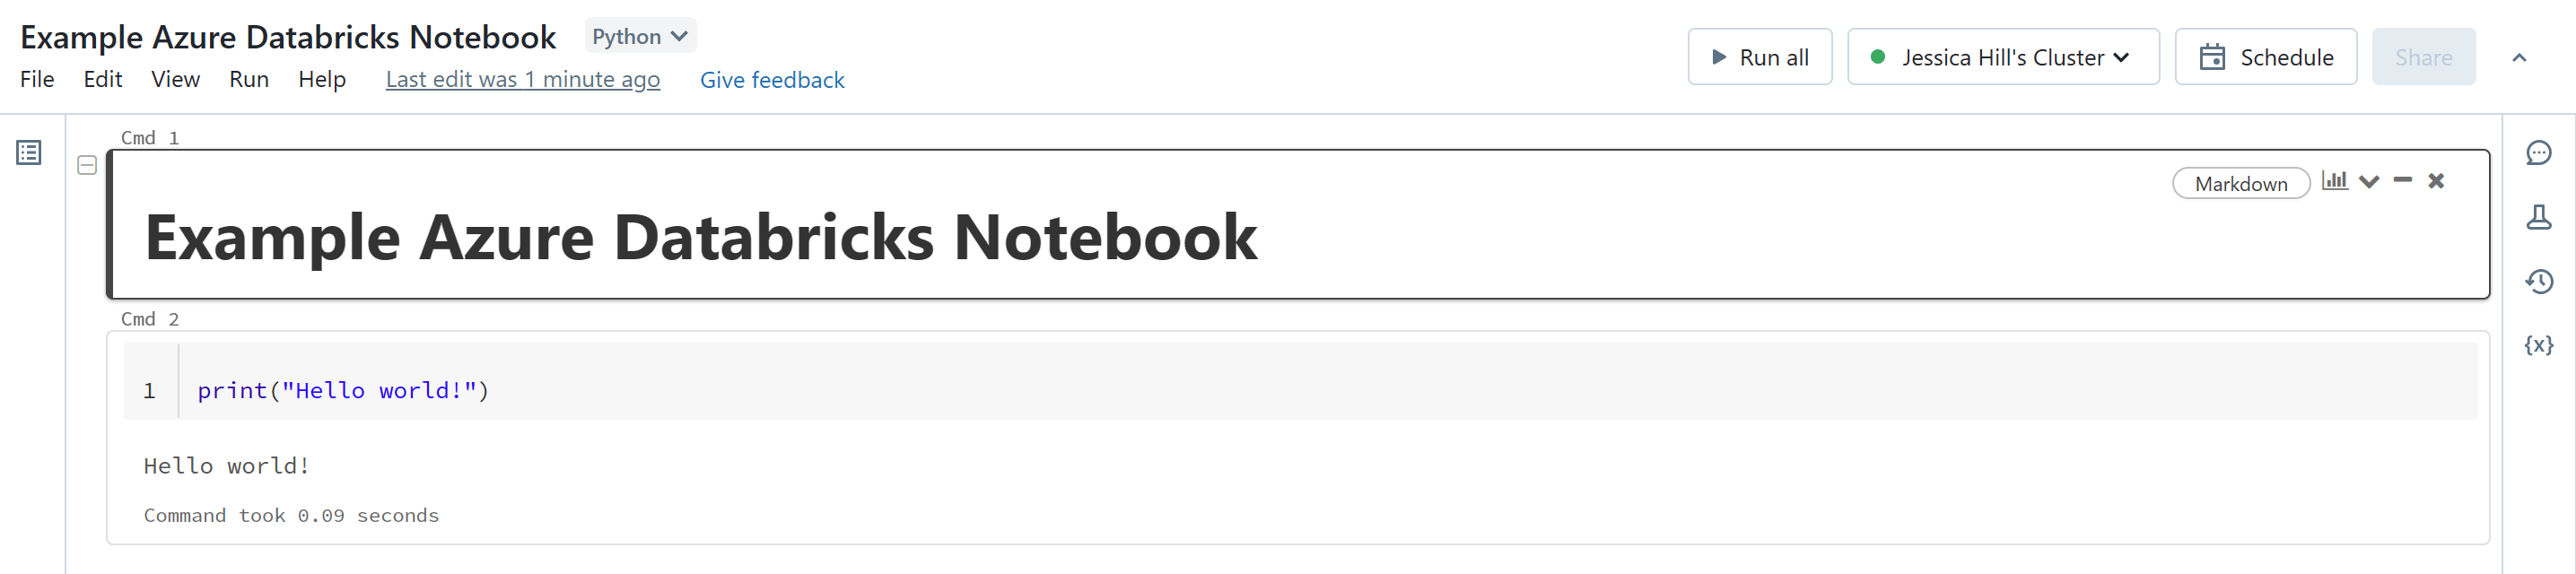
Azure Databricks, a hosted Databricks service, has its own notebook experience. An Azure Databricks Notebook is a collaborative, interactive interface which provides an intuitive way to combine live code, narrative text and visualisations. Azure Databricks Notebooks support exploratory data analysis, hypothesis testing, data cleaning and transformation, data visualisation, statistical modeling and machine learning.
What are Azure Databricks Notebooks?
With Azure Databricks notebooks, you can:
- Develop code using Python, SQL, Scala, and R.
- Store live code, visualisations and markdown documentation.
- Utilise the computing power of Apache Spark.
- Analyse data across raw formats (CSV, txt, JSON, etc.), processed file formats (parquet, Delta Lake, ORC, etc.)
- Export results and notebooks in .html or .ipynb format.
- Use a Git-based repository to store your notebooks with associated files and dependencies.
- Customize your environment with the libraries of your choice.
Azure Databricks Notebooks Key Features
There are a number of key features of Azure Databricks Notebooks:
| Feature | Description |
|---|---|
| Table of Contents | The table of contents is automatically generated from the Markdown headings used in the notebook for quick navigation. |
| Variables Pane | With Databricks Runtime 12.1 and above, you can directly observe current Python variables in the notebook UI. The variable explorer pane shows the value and data type, including shape, for each variable that is currently defined in the notebook. |
| Comments | You can have discussions with collaborators in any part of the notebook using command comments. |
| Code Cells | Code cells contain the code you're going to run. For example, you could write code for writing/reading out data, training a machine learning model, or generating visualisations. |
| Markdown Cells | Markdown cells render into text and graphics when the cell is executed and can be used to document or illustrate your code. |
| Collapsible Headings | Cells that appear after cells containing markdown headings can be collapsed into the heading cell. |
| Hide/Show Cell Content | You can opt to hide or show the output of each cell. |
| Widgets | Input widgets allow you to add parameters to your notebooks. Databricks widgets are best for building a notebook that is re-executed with different parameters or quickly exploring results of a single query with different parameters. |
| Version History | Azure Databricks automatically maintains a history of notebook versions which you can find in the 'Revision History' tab. You can also sync your Azure Databricks Notebooks with a remote Git repository. |
| Dashboards | Dashboards allow you to publish graphs and visualisations, and then share them in a presentation format with your organisation. You can create dashboards based on notebook cell outputs. |
Creating an Azure Databricks Notebook
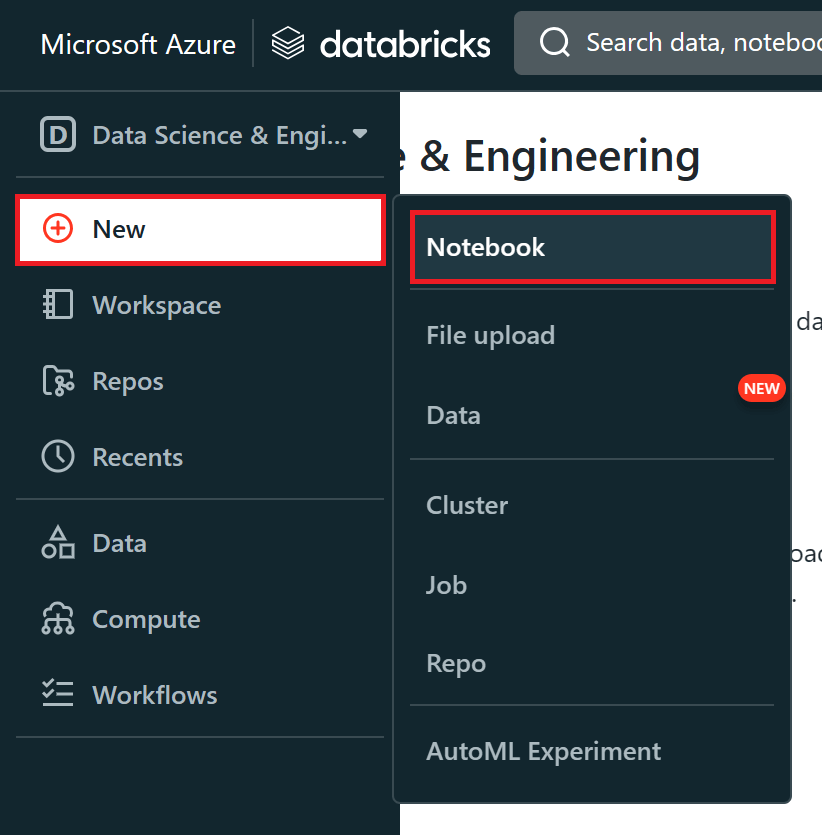
The initial set up of an Azure Databricks Notebook is easy. You will first need to launch your Azure Databricks workspace. Then you will need to click the 'New' button in the sidebar and select 'Notebook' from the menu. This will create a new notebook in your default folder.
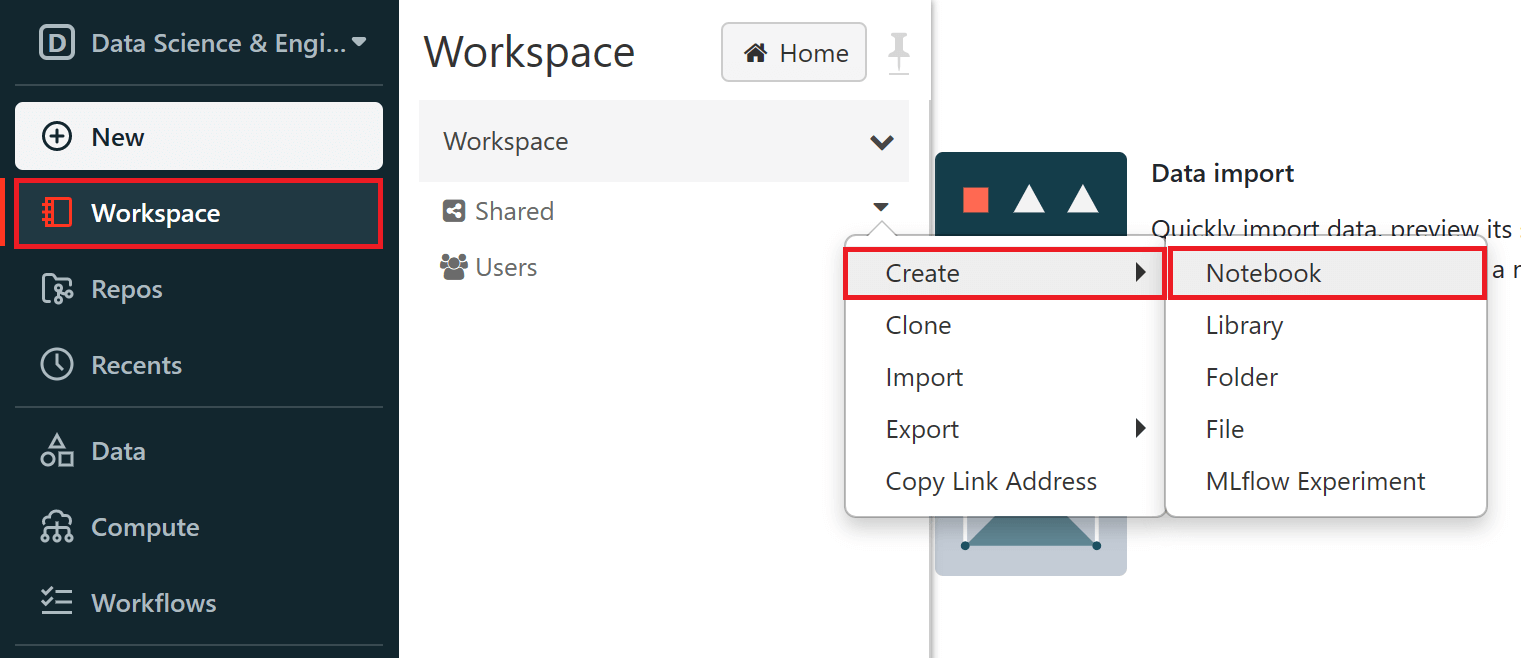
You can also create a new notebook in a specific folder. Folders contain all statics assets within a workspace (notebooks, libraries, files). An Azure Databricks workspace has three special folders: 'Workspace', 'Shared' and 'Users' and you can also create your own folders. To create a new notebook in a specific folder, you will need to navigate to the 'Workspace' tab in the sidebar. Here, you should select the pulldown arrow for a folder within that workspace and then select 'Create > Notebook'.
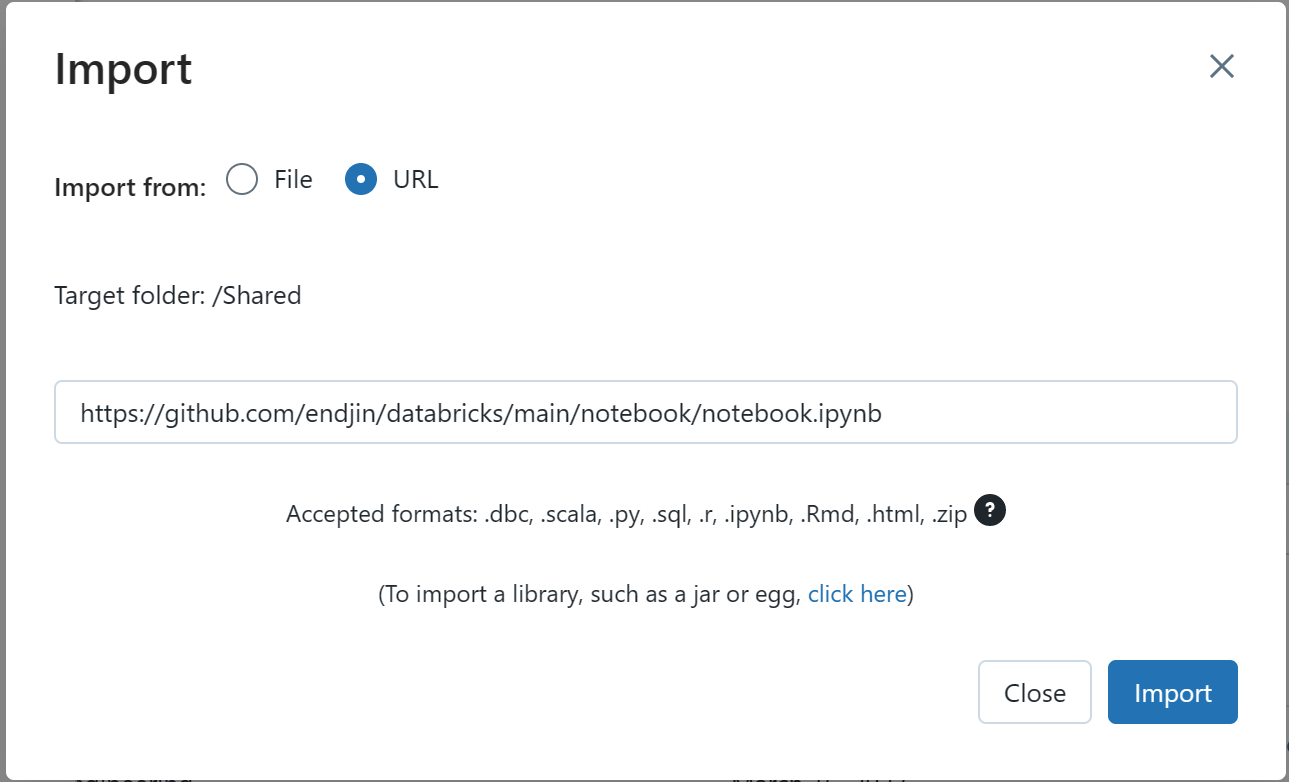
You can also import existing notebooks from GitHub or your local file system by selecting the pulldown arrow for the workspace or any folder within that workspace and then select 'Import'. The 'Import Notebooks' pop-up menu will appear where you can import from file or URL. For example, you could import a Jupyter notebook from your local file system, or, you could import a notebook from GitHub by selecting the URL option and pasting the notebook raw URL from GitHub.
Azure Databricks Notebooks & Apache Spark
Apache Spark is distributed data processing framework that enables large-scale data analytics by co-ordinating work across multiple processing nodes in a cluster. Databricks, founded by the creators of Apache Spark, provides an optimised version of Spark with extra features which offer increased performance.
Databricks is a more focused Spark offering compared to other products such as Azure Synapse Analytics. If you want to run a purely Spark-based approach, optimised for large volume, high-performance or high-concurrency Spark usage, then Databricks achieves this.
In Azure Databricks, a cluster is a set of computation resources and configurations which provide a runtime for your data science workloads. These workloads can be run as a set of commands in an Azure Databricks Notebook. An Azure Databricks cluster consists of one driver node and zero or more worker nodes. The driver node interprets all of the commands that you run from a notebook and also runs the Apache Spark master that co-ordinates the execution of those commands by the worker nodes in the cluster.
It's important to note that while Azure Databricks clusters come with associated costs. Therefore, it's vital to consider the cost implications of your cluster configuration choices. In Azure Databricks, you have the option of an 'always-on' cluster or you can enable auto-scaling. An 'always-on' cluster remains active at all times, ensuring that your workloads can be executed without any delay whenever you need them. However, this convenience comes at a cost, as you are paying for the cluster's resources continuously, regardless of whether they are actively processing tasks or not.
On the other hand, you can leverage the auto-scaling feature to dynamically adjust the number of worker nodes based on workload demand. This approach offers significant cost savings since you are only consuming resources when they are actually needed. The cluster can automatically scale up during peak usage and then scale down during periods of lower demand. While this can lead to some delay in cluster startup as resources are allocated, the cost-efficiency gained from avoiding constant resource usage is often a compelling advantage. By understanding these trade-offs between instant availability and cost savings, you can tailor your Azure Databricks cluster strategy to align with your budget and performance requirements.
To create a cluster, you need to navigate to the 'Compute' tab in the sidebar of your Azure Databricks workspace to access the cluster creation interface. There are two different types of clusters in Azure Databricks - all-purpose clusters and job clusters. Azure Databricks Notebooks use all-purpose clusters. All-purpose clusters can be shared by multiple users enabling collaborative interactive analysis within a notebook.
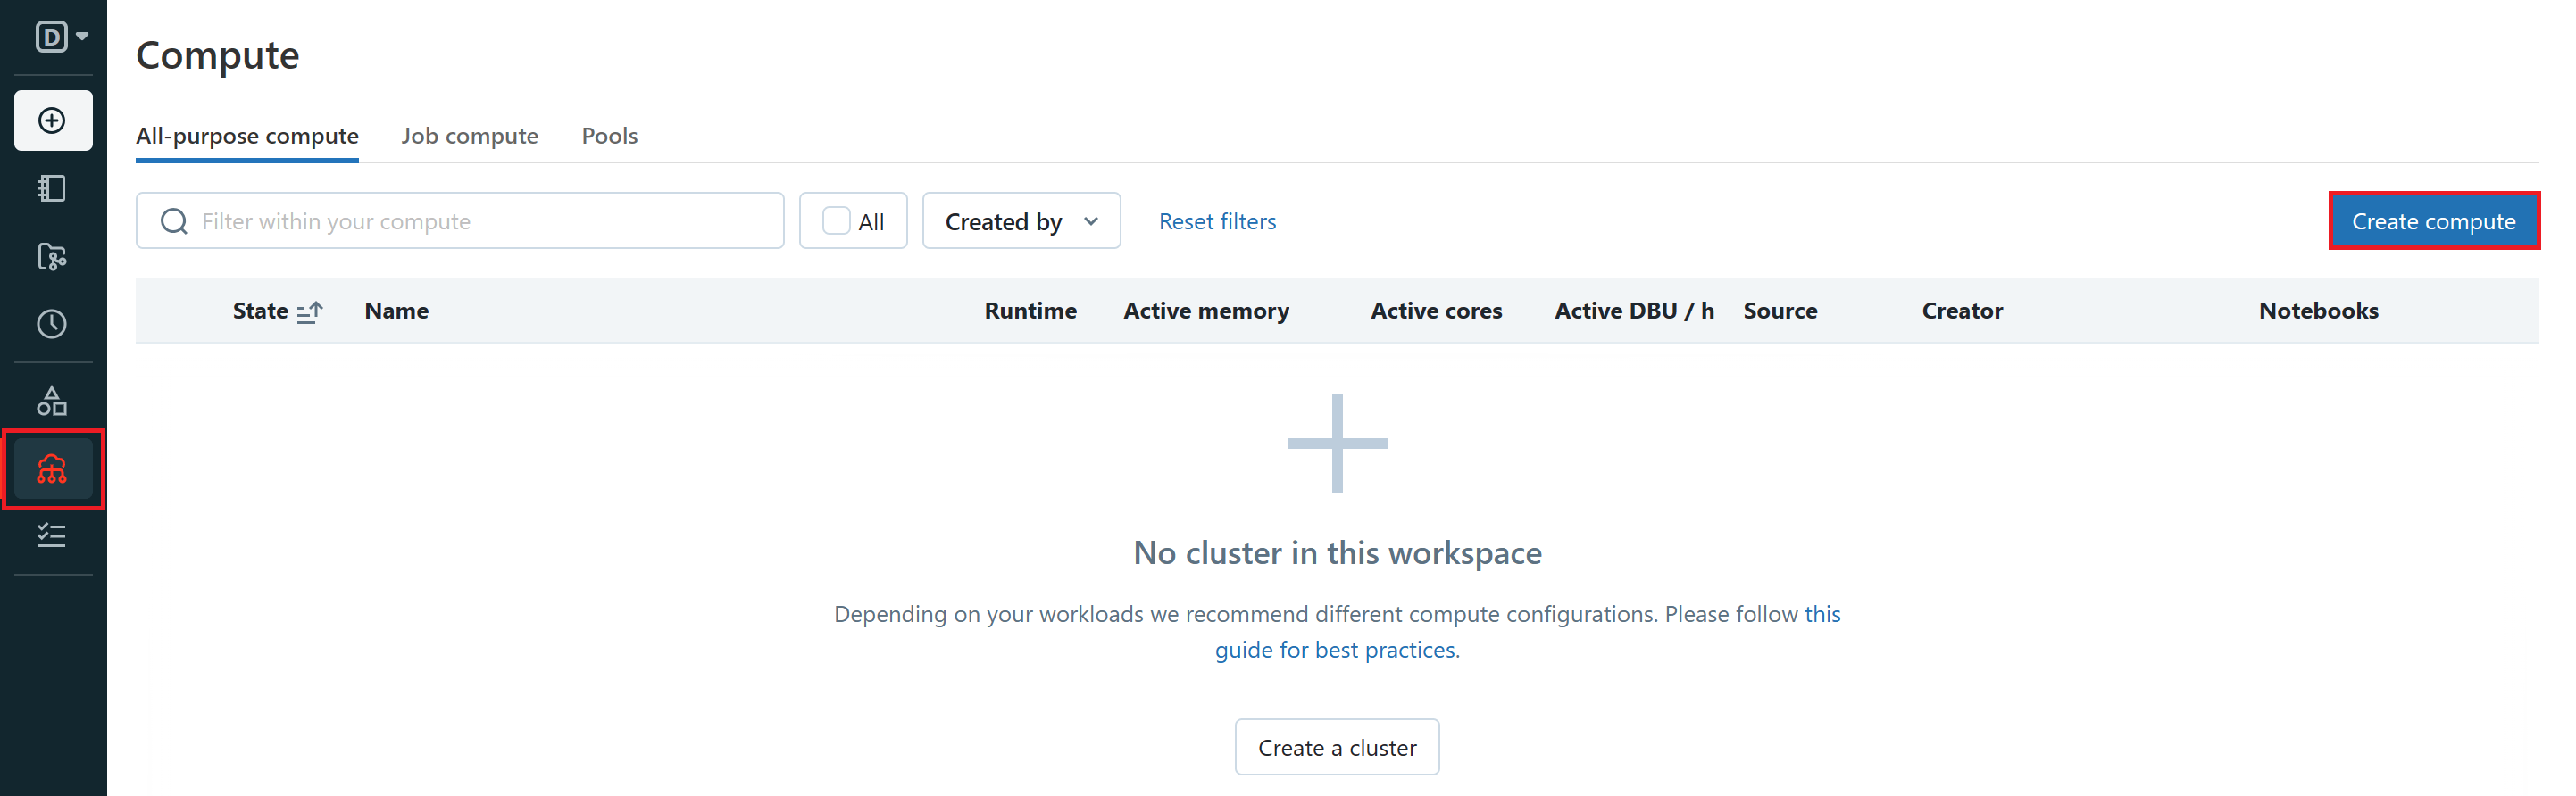
During cluster creation, you can specify an inactivity period (in minutes) after which you want the cluster to terminate. This means that the cluster your Azure Databricks Notebook is attached to will automatically be terminated if the difference between the current time and the last command run on the cluster is more than the inactivity period specified. You can also manually terminate and restart the cluster from inside of the Azure Databricks Notebook interface.
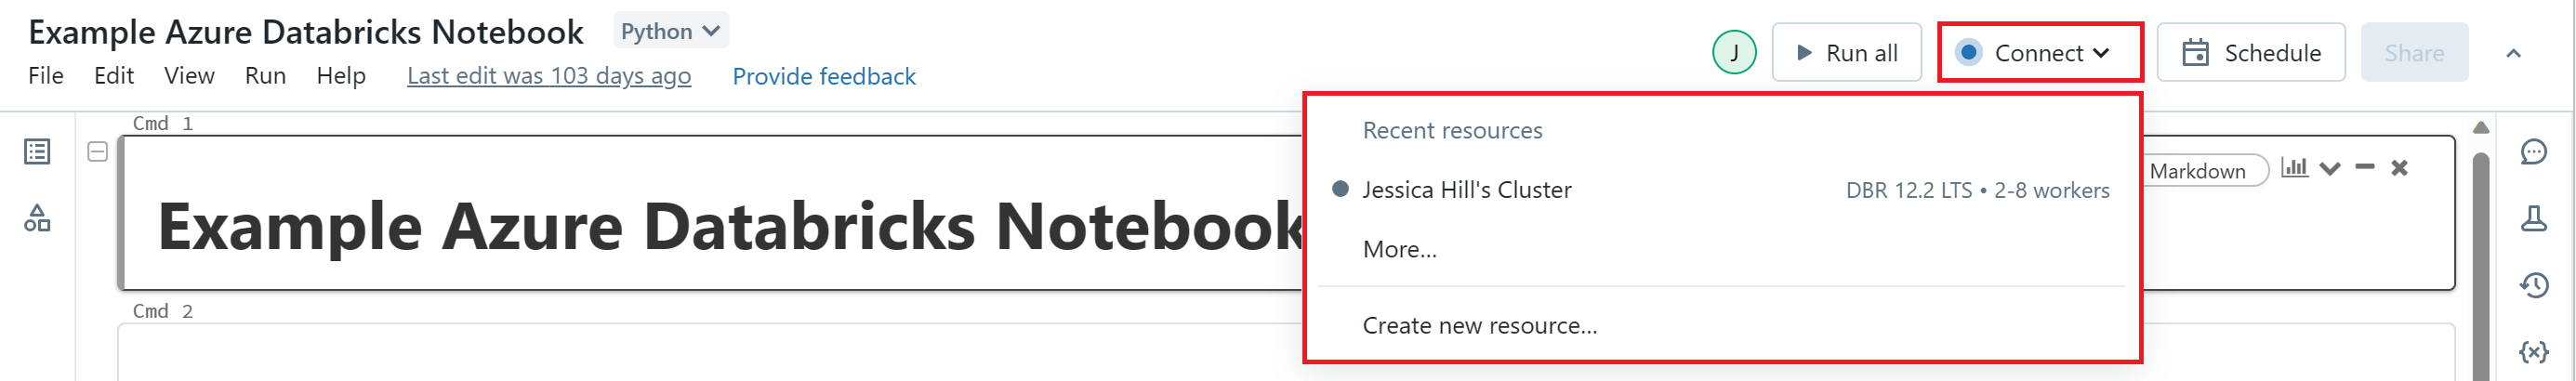
You can attach your Azure Databricks Notebook to a cluster of your choice by selecting a cluster from the 'Connect' drop-down menu in the top command bar.
Programming Language Support
Azure Databricks Notebooks support four default programming languages:
- Python
- SQL
- Scala
- R
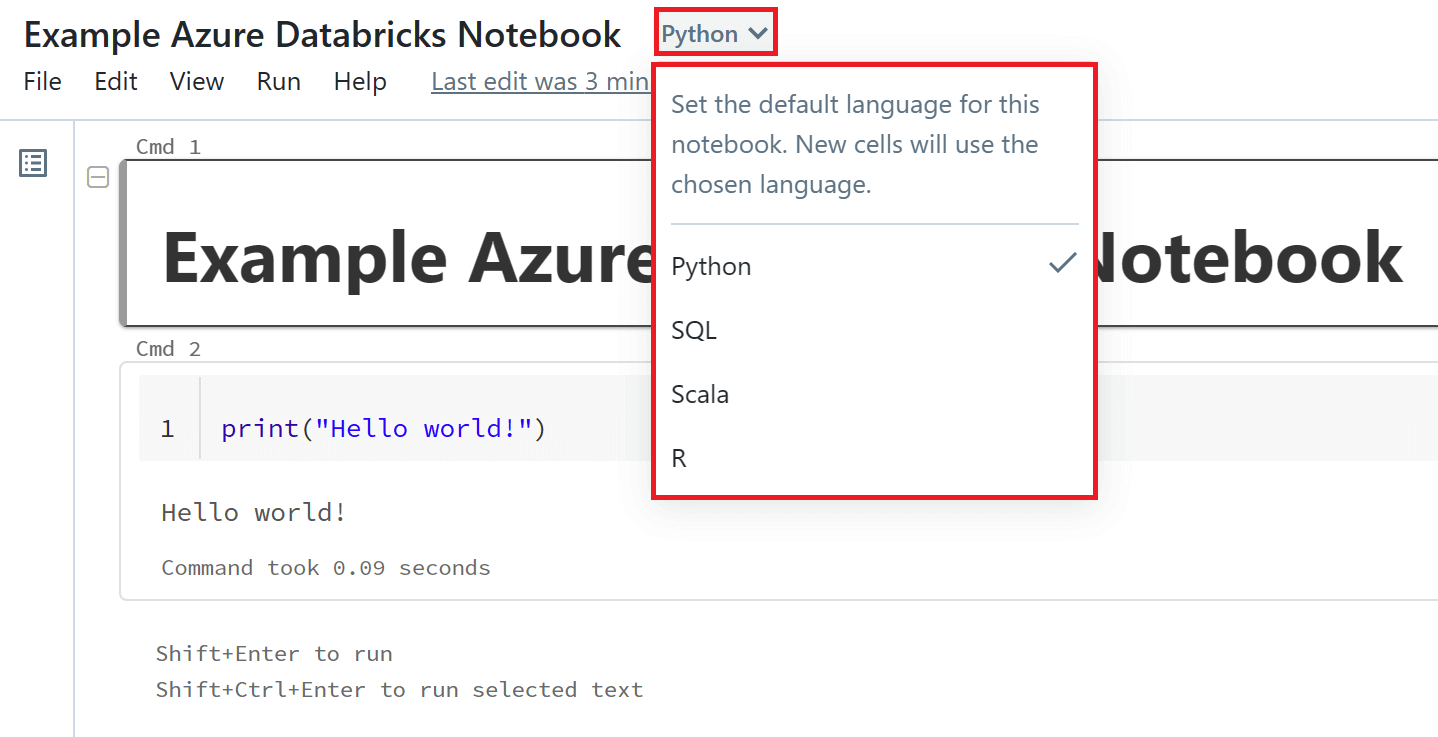
All new cells that you create will use the default language of the notebook. The default language in a new Azure Databricks Notebook is Python. Once you have created your notebook, you can change the default language by clicking the 'Language' button at the top of your notebook next to the notebook name and selecting a new language from the drop-down menu.
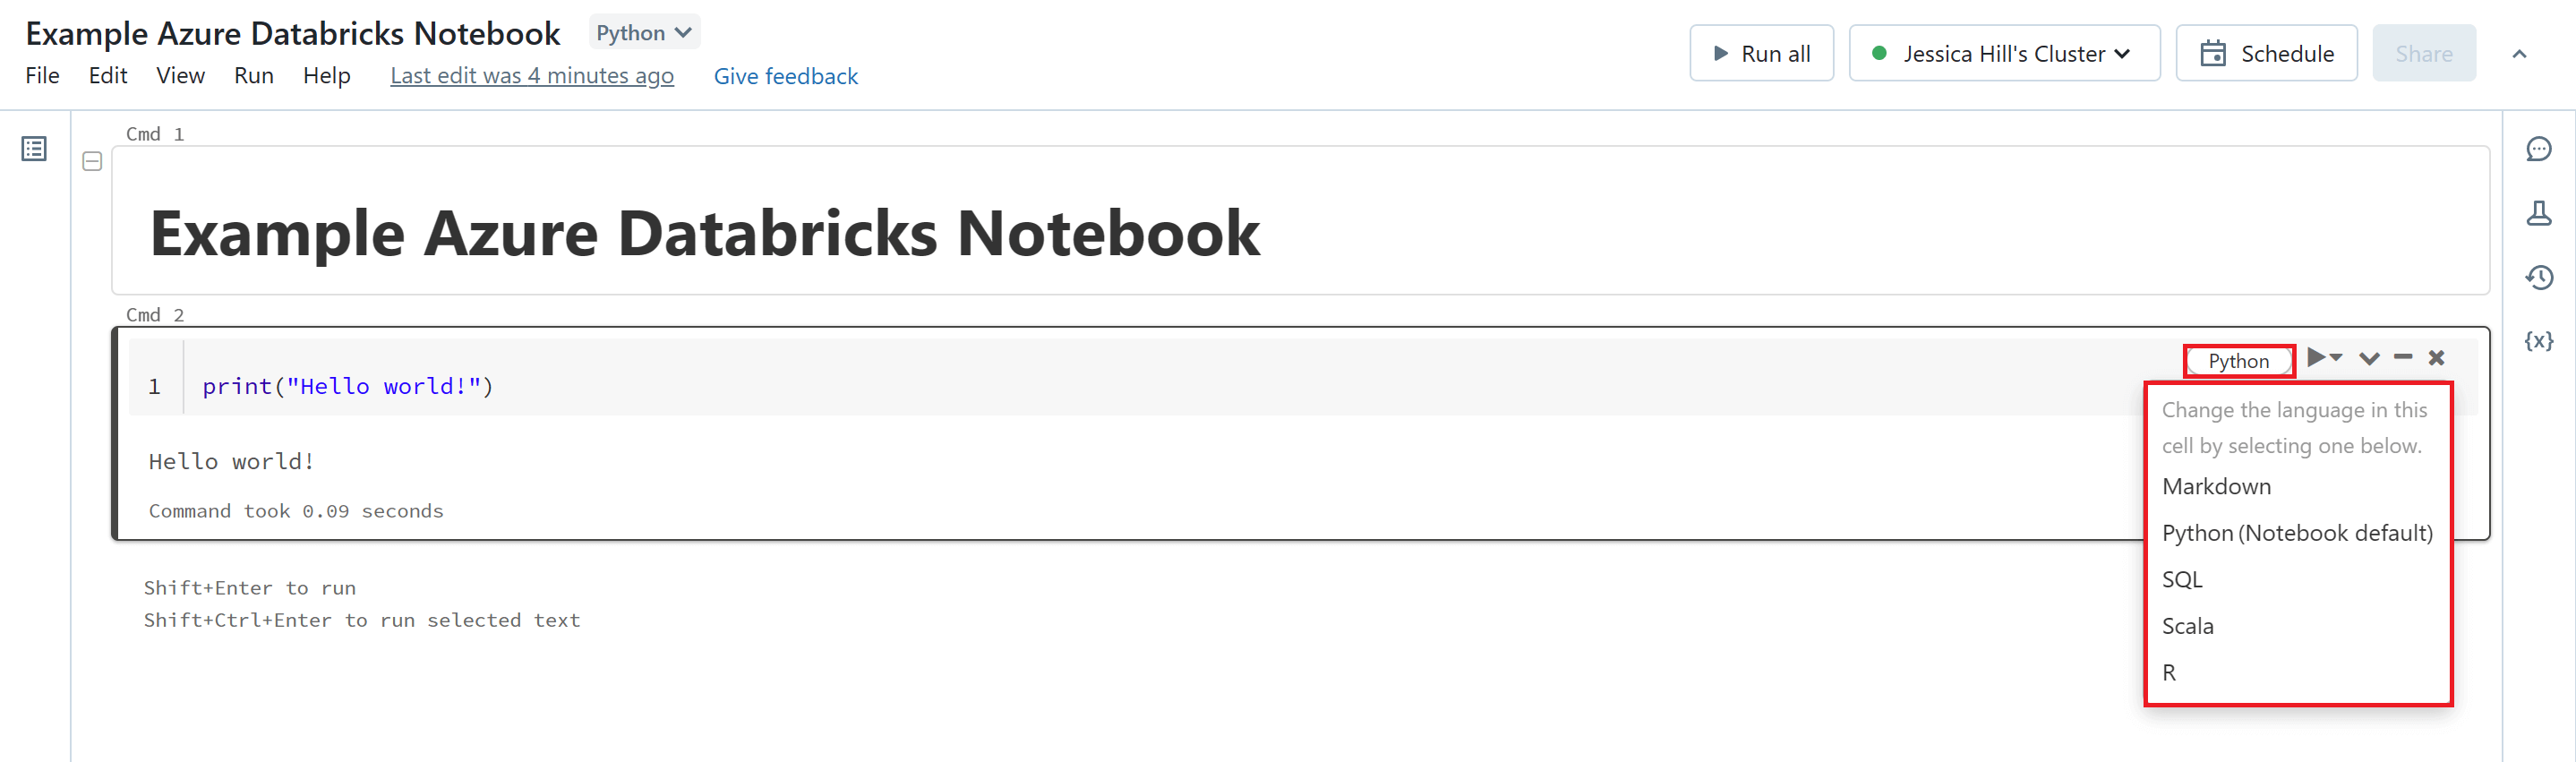
Azure Databricks Notebooks give you a lot of flexibility and versatility by providing multi-language support. This means that you can switch between different languages within the same notebook. You can override the default language in a specific cell by clicking the 'Language' button at the top of your chosen cell and selecting a language from the drop-down menu. You can also change the code cell to a Markdown cell by selecting the 'Markdown' option from this drop-down menu.
Alternately, you can use the language magic command %
- %python
- %r
- %scala
- %sql
- %md
It is important to note that you cannot reference data or variables directly across different languages in a Azure Databricks Notebook, unlike Polyglot Notebooks (powered by .NET Interactive) where sharing of variables between languages is supported. The simplest way to share a dataframe between languages in an Azure Databricks notebook is to create a temporary table that can be referenced across languages. It is also possible to share single variables (in string format), between languages in notebook using the spark context.
Visualisations
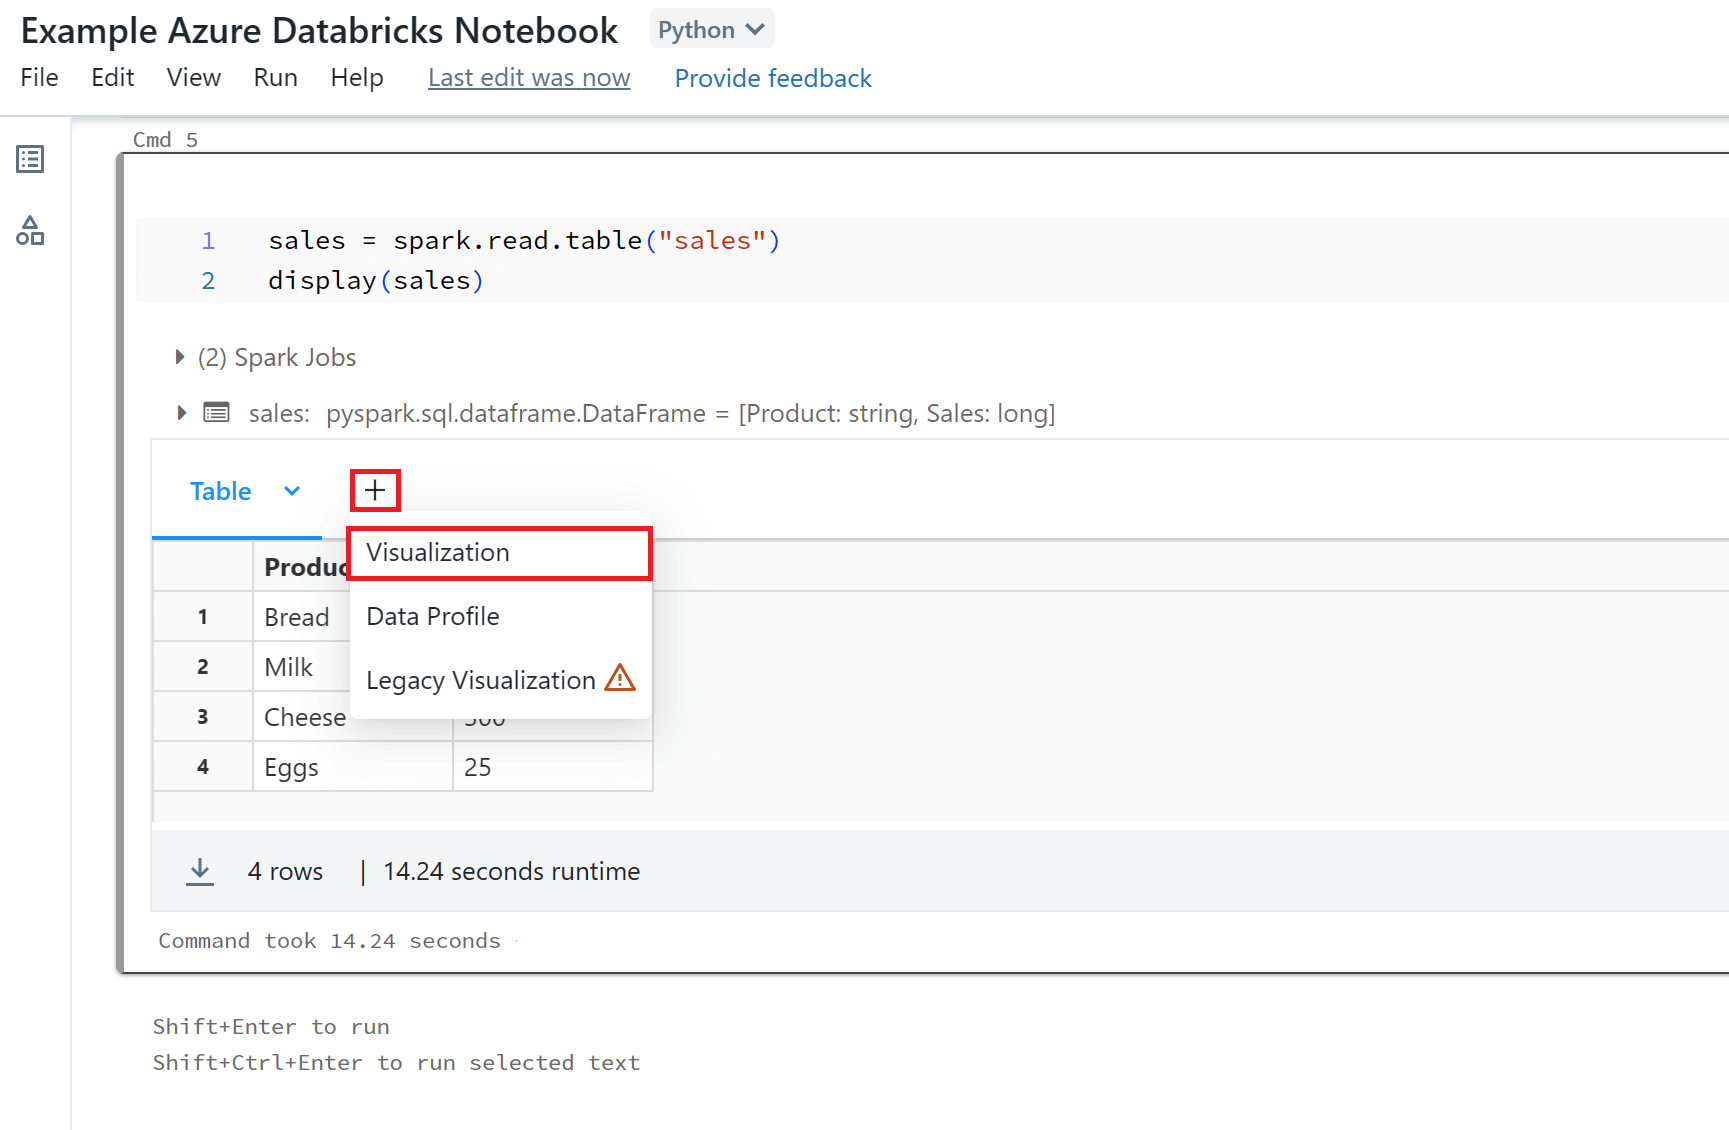
Azure Databricks Notebooks have built-in support for visualisations. To view your Spark dataframes as visualisations you will need to use the display() function. The display() function allows you to visualise your dataframes in tabular format. You can then quickly view this data with a number of different visualisation types. To create a visualisation you will need to select the '+' button above the tabular results and select 'Visualisation'.
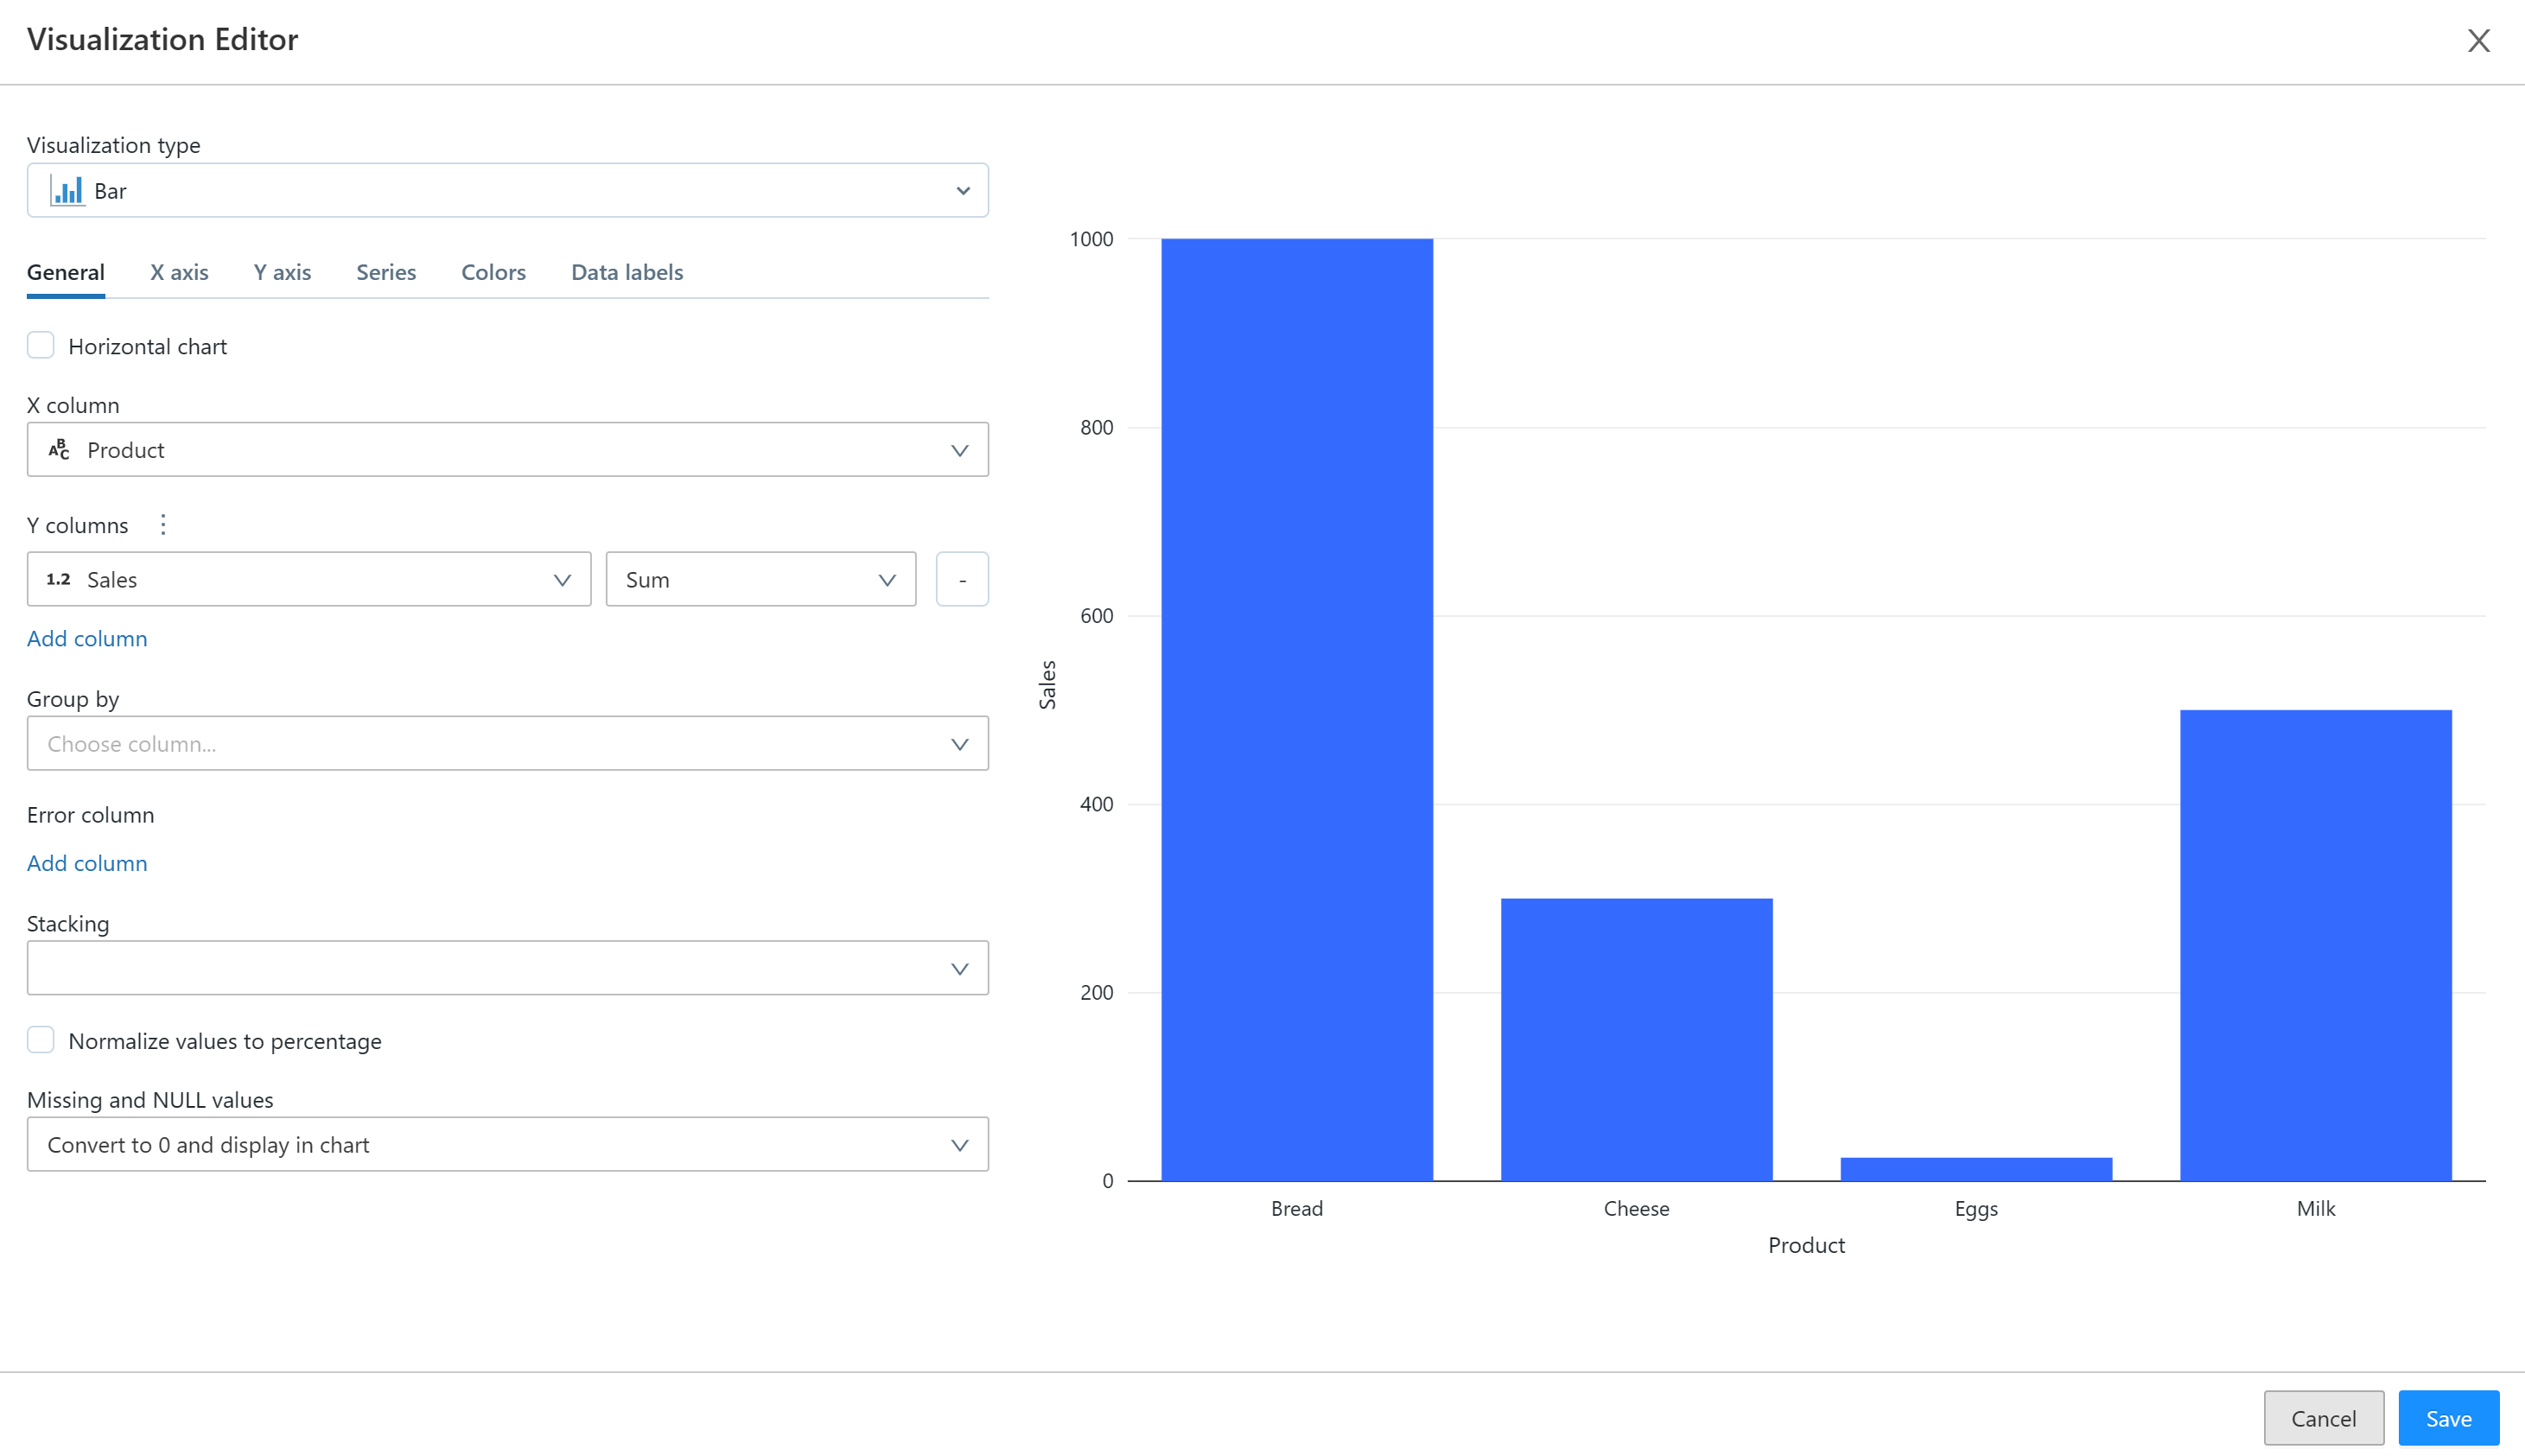
In the visualisation editor you can choose a visualisation type and configure your visual. There are various different visualisation types you can choose from including box plots, charts (scatter, bar, line, pie etc.), heatmaps and tables.
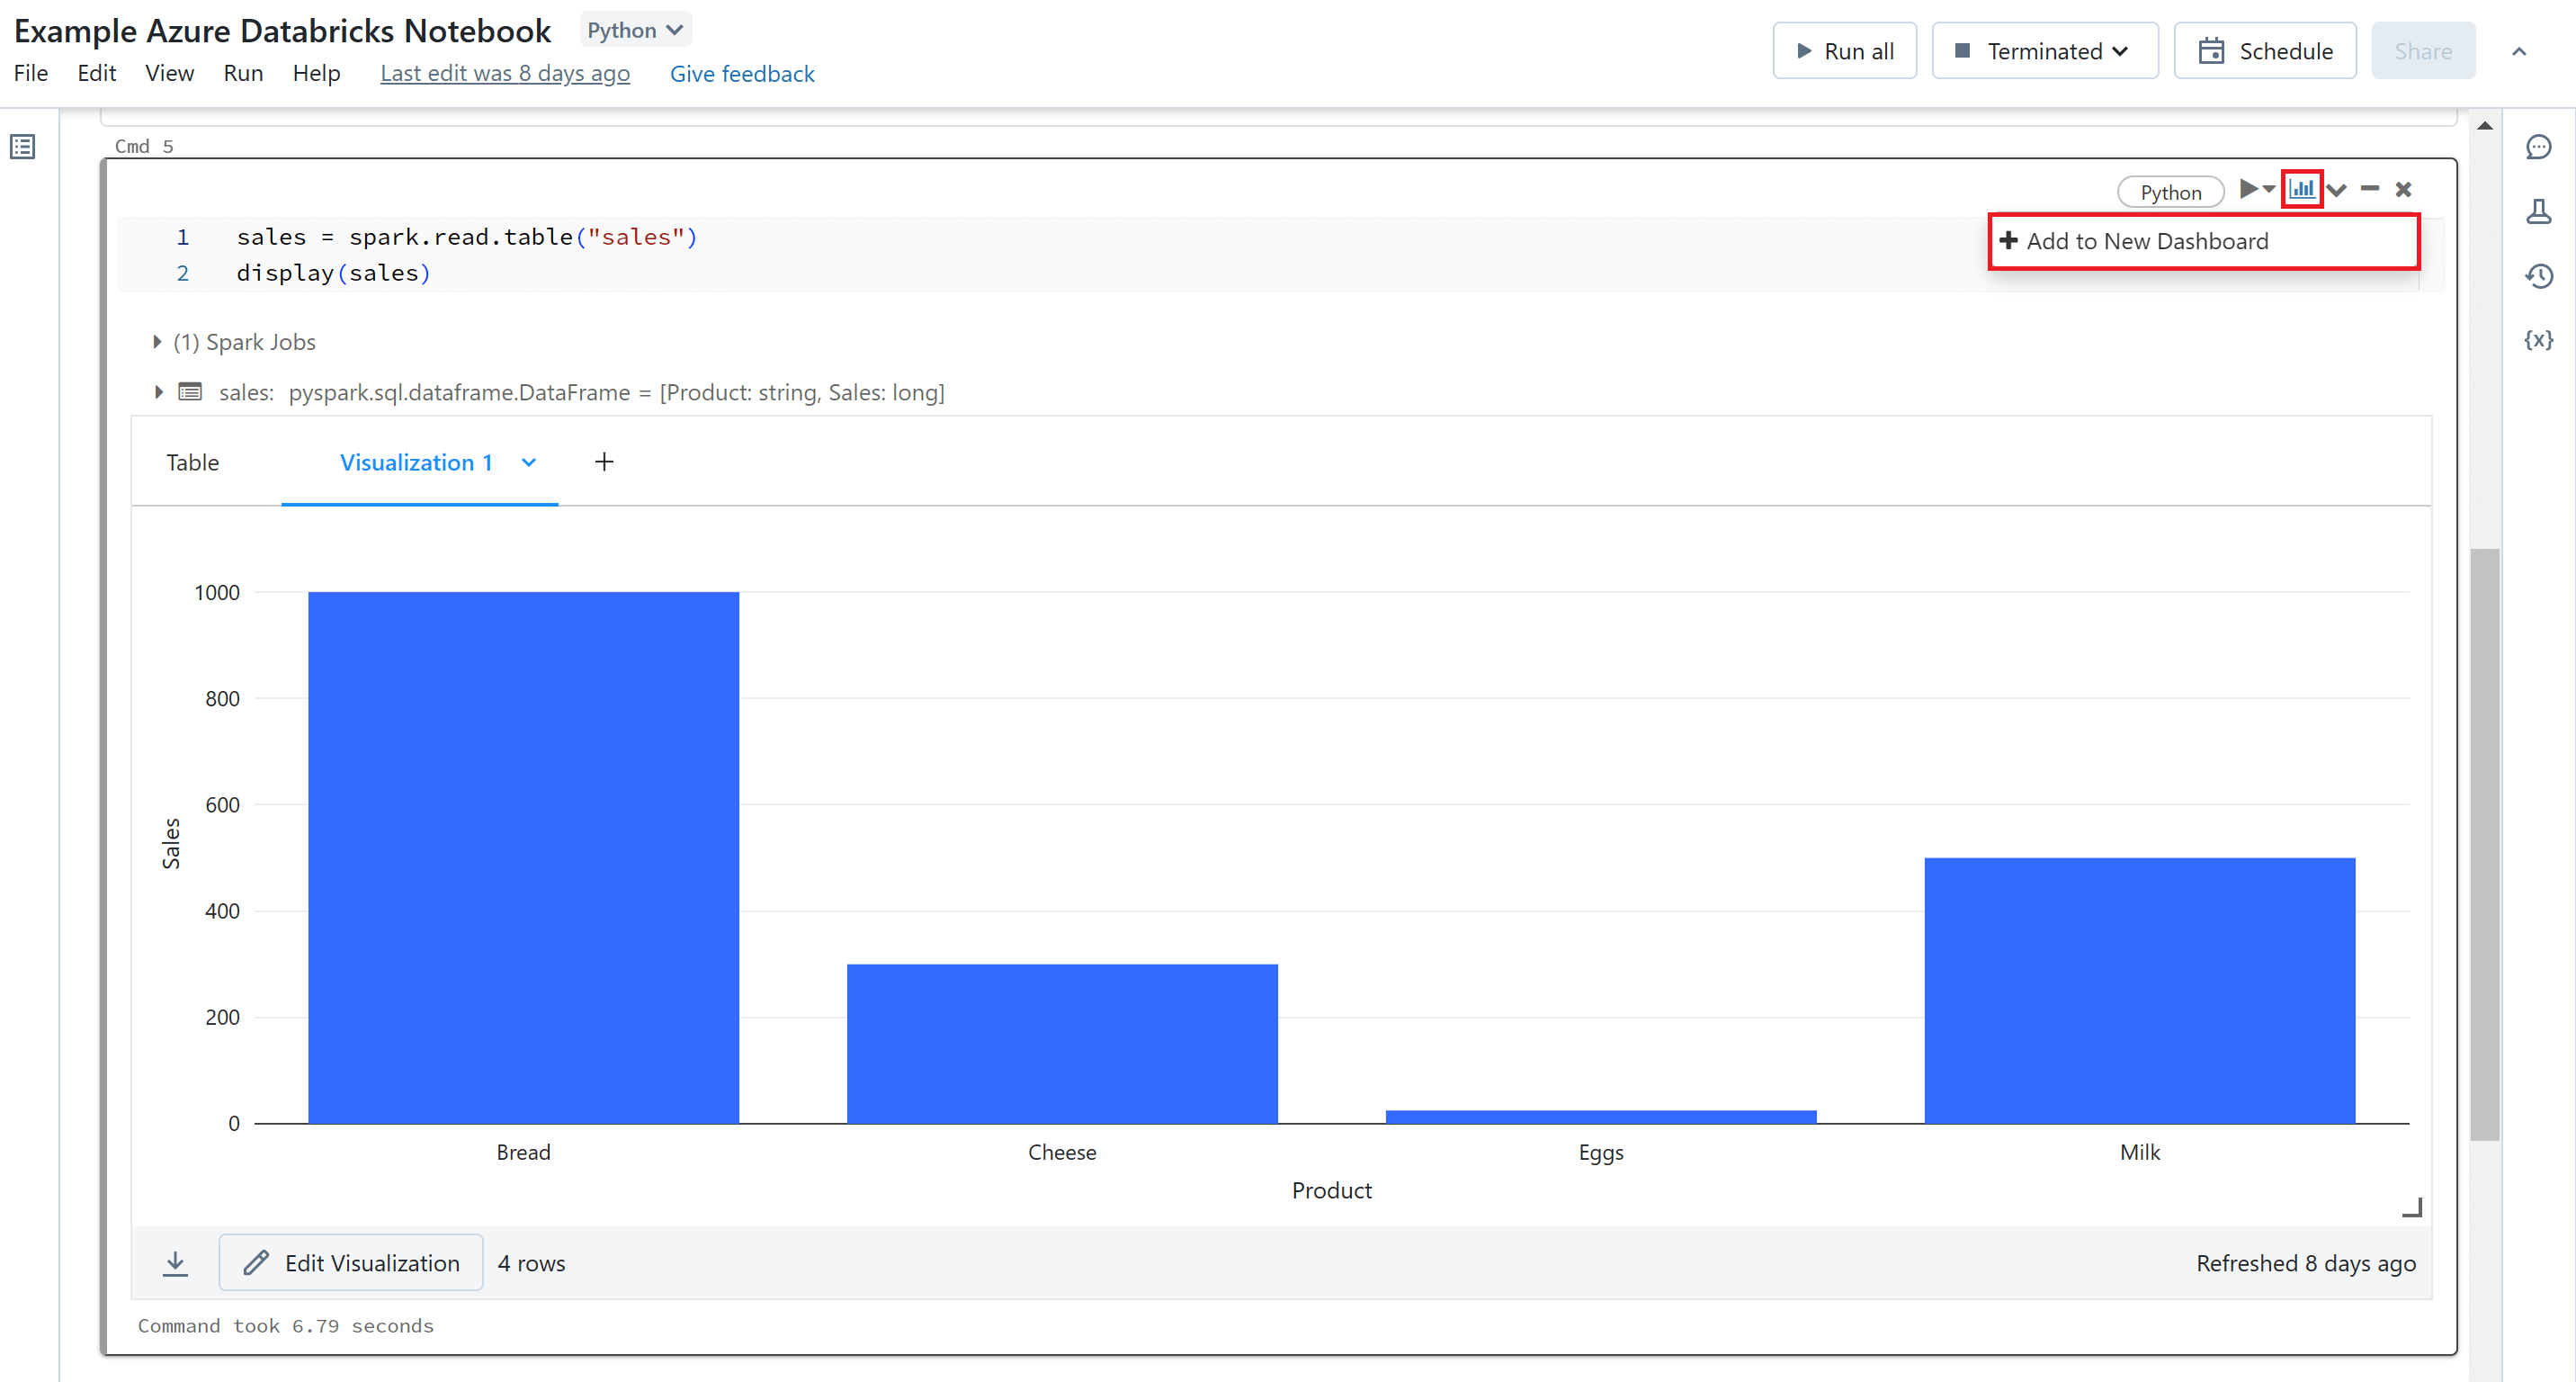
After creating your visualisations you can create a dashboard to pull them all together. To add a visual to a dashboard you will need to select the dashboard icon at the top of the cell and either select the name of an existing dashboard or select 'Add to New Dashboard' to create a new dashboard. You can also download your visualisations as a CSV, TSV or Excel files.
Libraries & Packages
By default, Azure Databricks provides a default set of open-source libraries and packages that are pre-installed onto Spark clusters. For example, there are a number of Python libraries such as PySpark and Pandas and graphing libraries for data visualisation including Matplotlib, Seaborn, Bokeh, Plotly.
You can also install additional libraries or different versions of libraries to use within your Azure Databricks Notebooks. In Azure Databricks, you can install libraries in three modes: cluster-installed, notebook-scoped, and workspace.
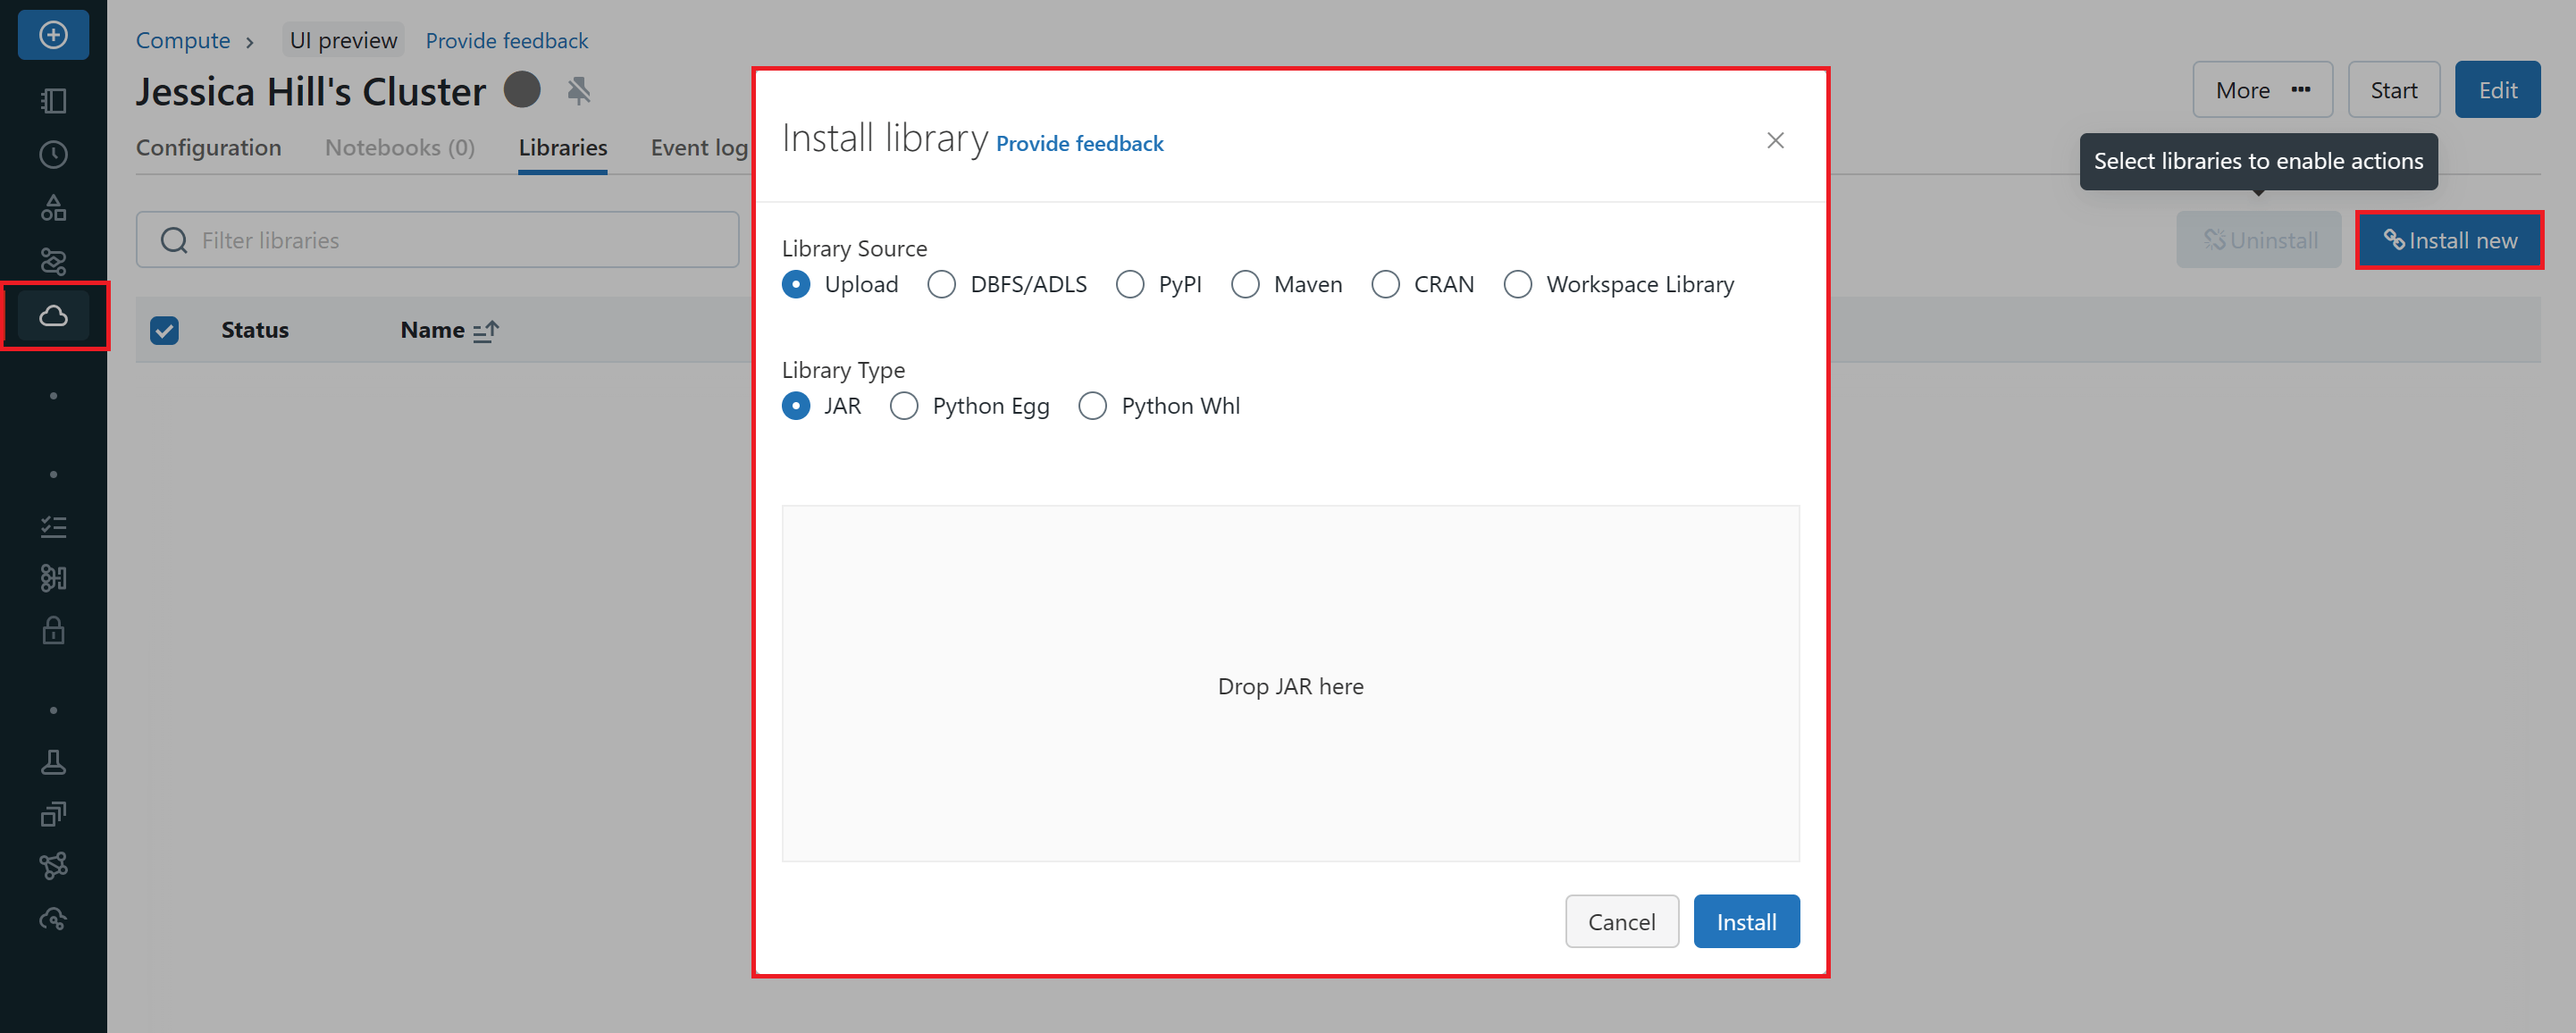
Cluster-installed libraries can be used by all notebooks running on a cluster. To manage libraries on your Spark cluster, navigate to the 'Compute' tab in your Azure Databricks workspace, select your cluster and click on the 'Libraries' tab in the cluster settings. Here, you can to install, update, or remove libraries from your Spark cluster. The changes will be applied to all notebooks running on that cluster.
Notebook-scoped libraries, using %pip install, allow you to install libraries and create an environment scoped to a notebook session. These libraries do not affect other notebooks running on the same cluster. Notebook-scoped libraries do not persist and must be re-installed for each session. You should use notebook-scoped libraries when you need a custom environment for a specific notebook.
Notebook-scoped libraries are only available for Python and R.
Workspace libraries serve as a local repository from which you can create cluster-installed libraries. A workspace library might be custom code created by your organization, or might be a particular version of an open-source library that your organization has standardized on.
Version Control
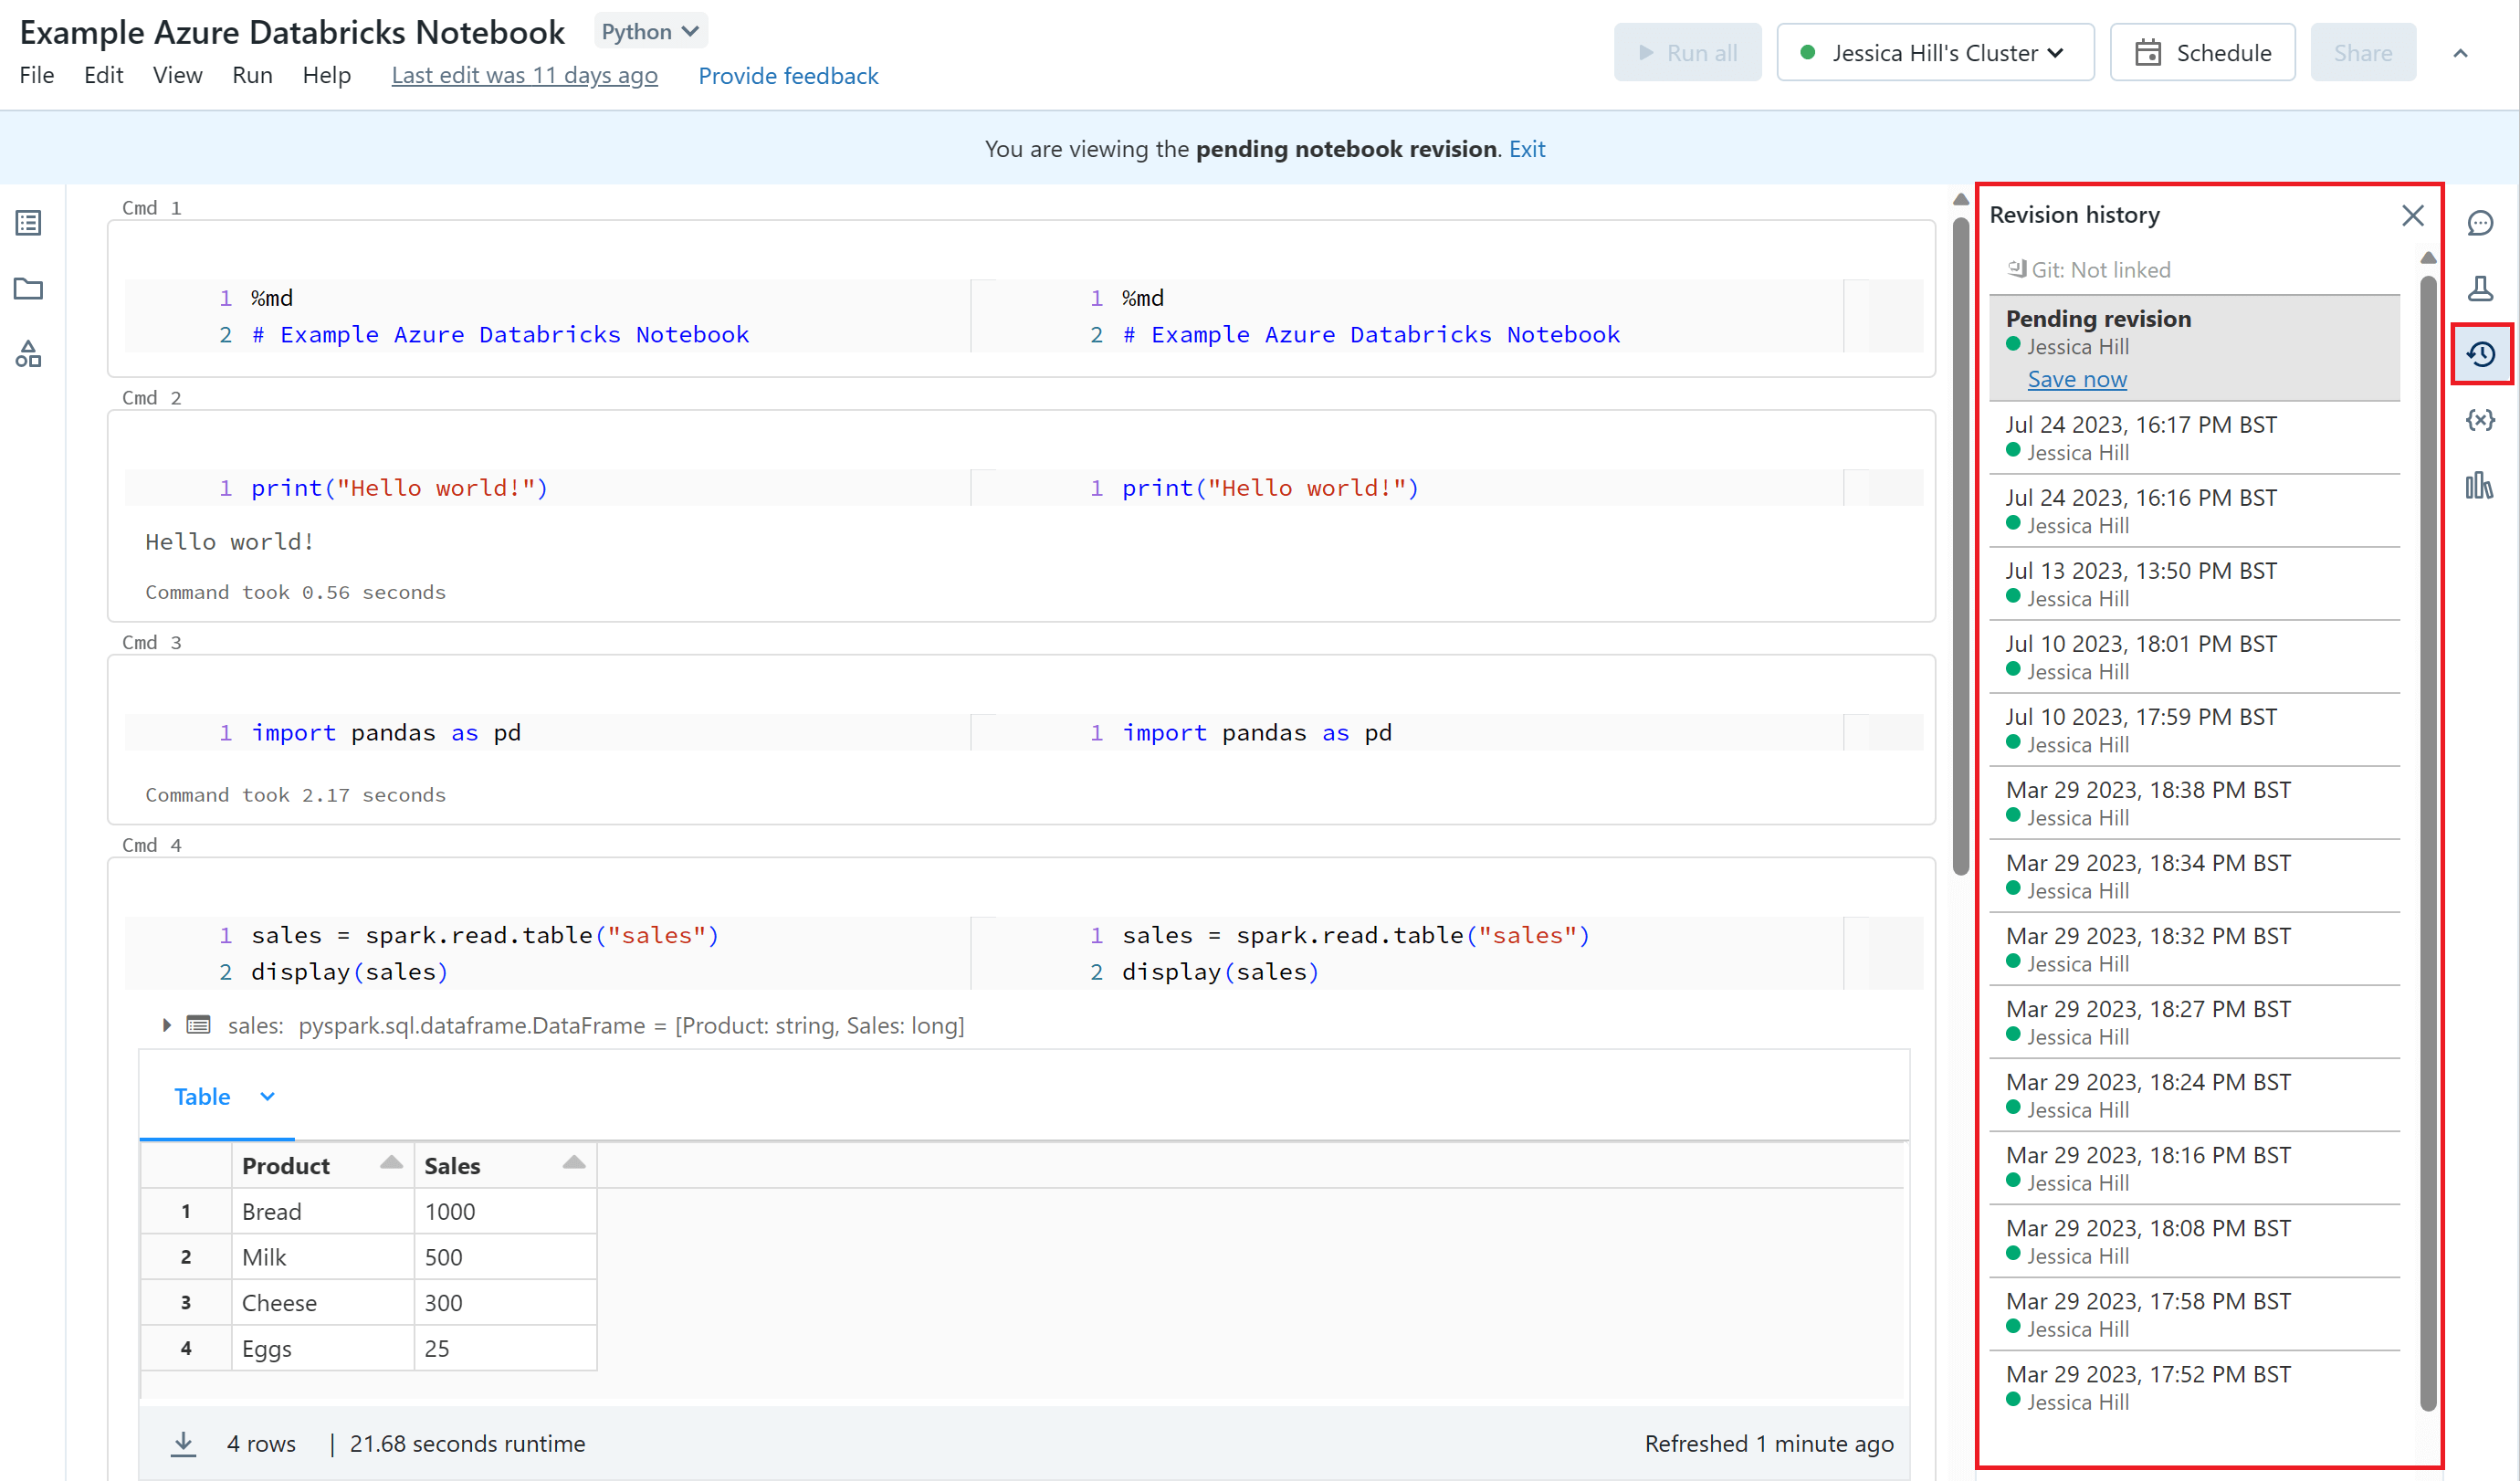
Azure Databricks Notebooks automatically maintain a history of notebook versions which you can view and restore. You can add comments to specific versions, you can restore and delete versions and you can also clear your version history. To view the version history of your Azure Databricks Notebook, you will need to navigate to the 'Revision History' tab in the right sidebar.
This also means that real time co-authoring of Azure Databricks Notebooks is supported. Two users can collaborate on the same notebook at the same time and see the changes being made by the other user in real time.
All users who wish to run the notebook must be assigned permission to use cluster attached to the notebook.
It is also possible to integrate your Azure Databricks Notebook with Git using Databricks Repos. This allows you to take advantage of Git functionality such as creating/cloning repositories, managing branches and reviewing and committing changes. Elisenda Gascon provides details on how to integrate your Azure Databricks Notebook with Git in her blog post: Version Control in Databricks.
Pipeline Integration
Azure Databricks Notebooks can be incorporated into a data ingestion or processing pipeline, such as an Azure Data Factory (ADF) Pipeline or an Azure Synapse Analytics (ASA) Pipeline using the Databricks Notebook Activity.
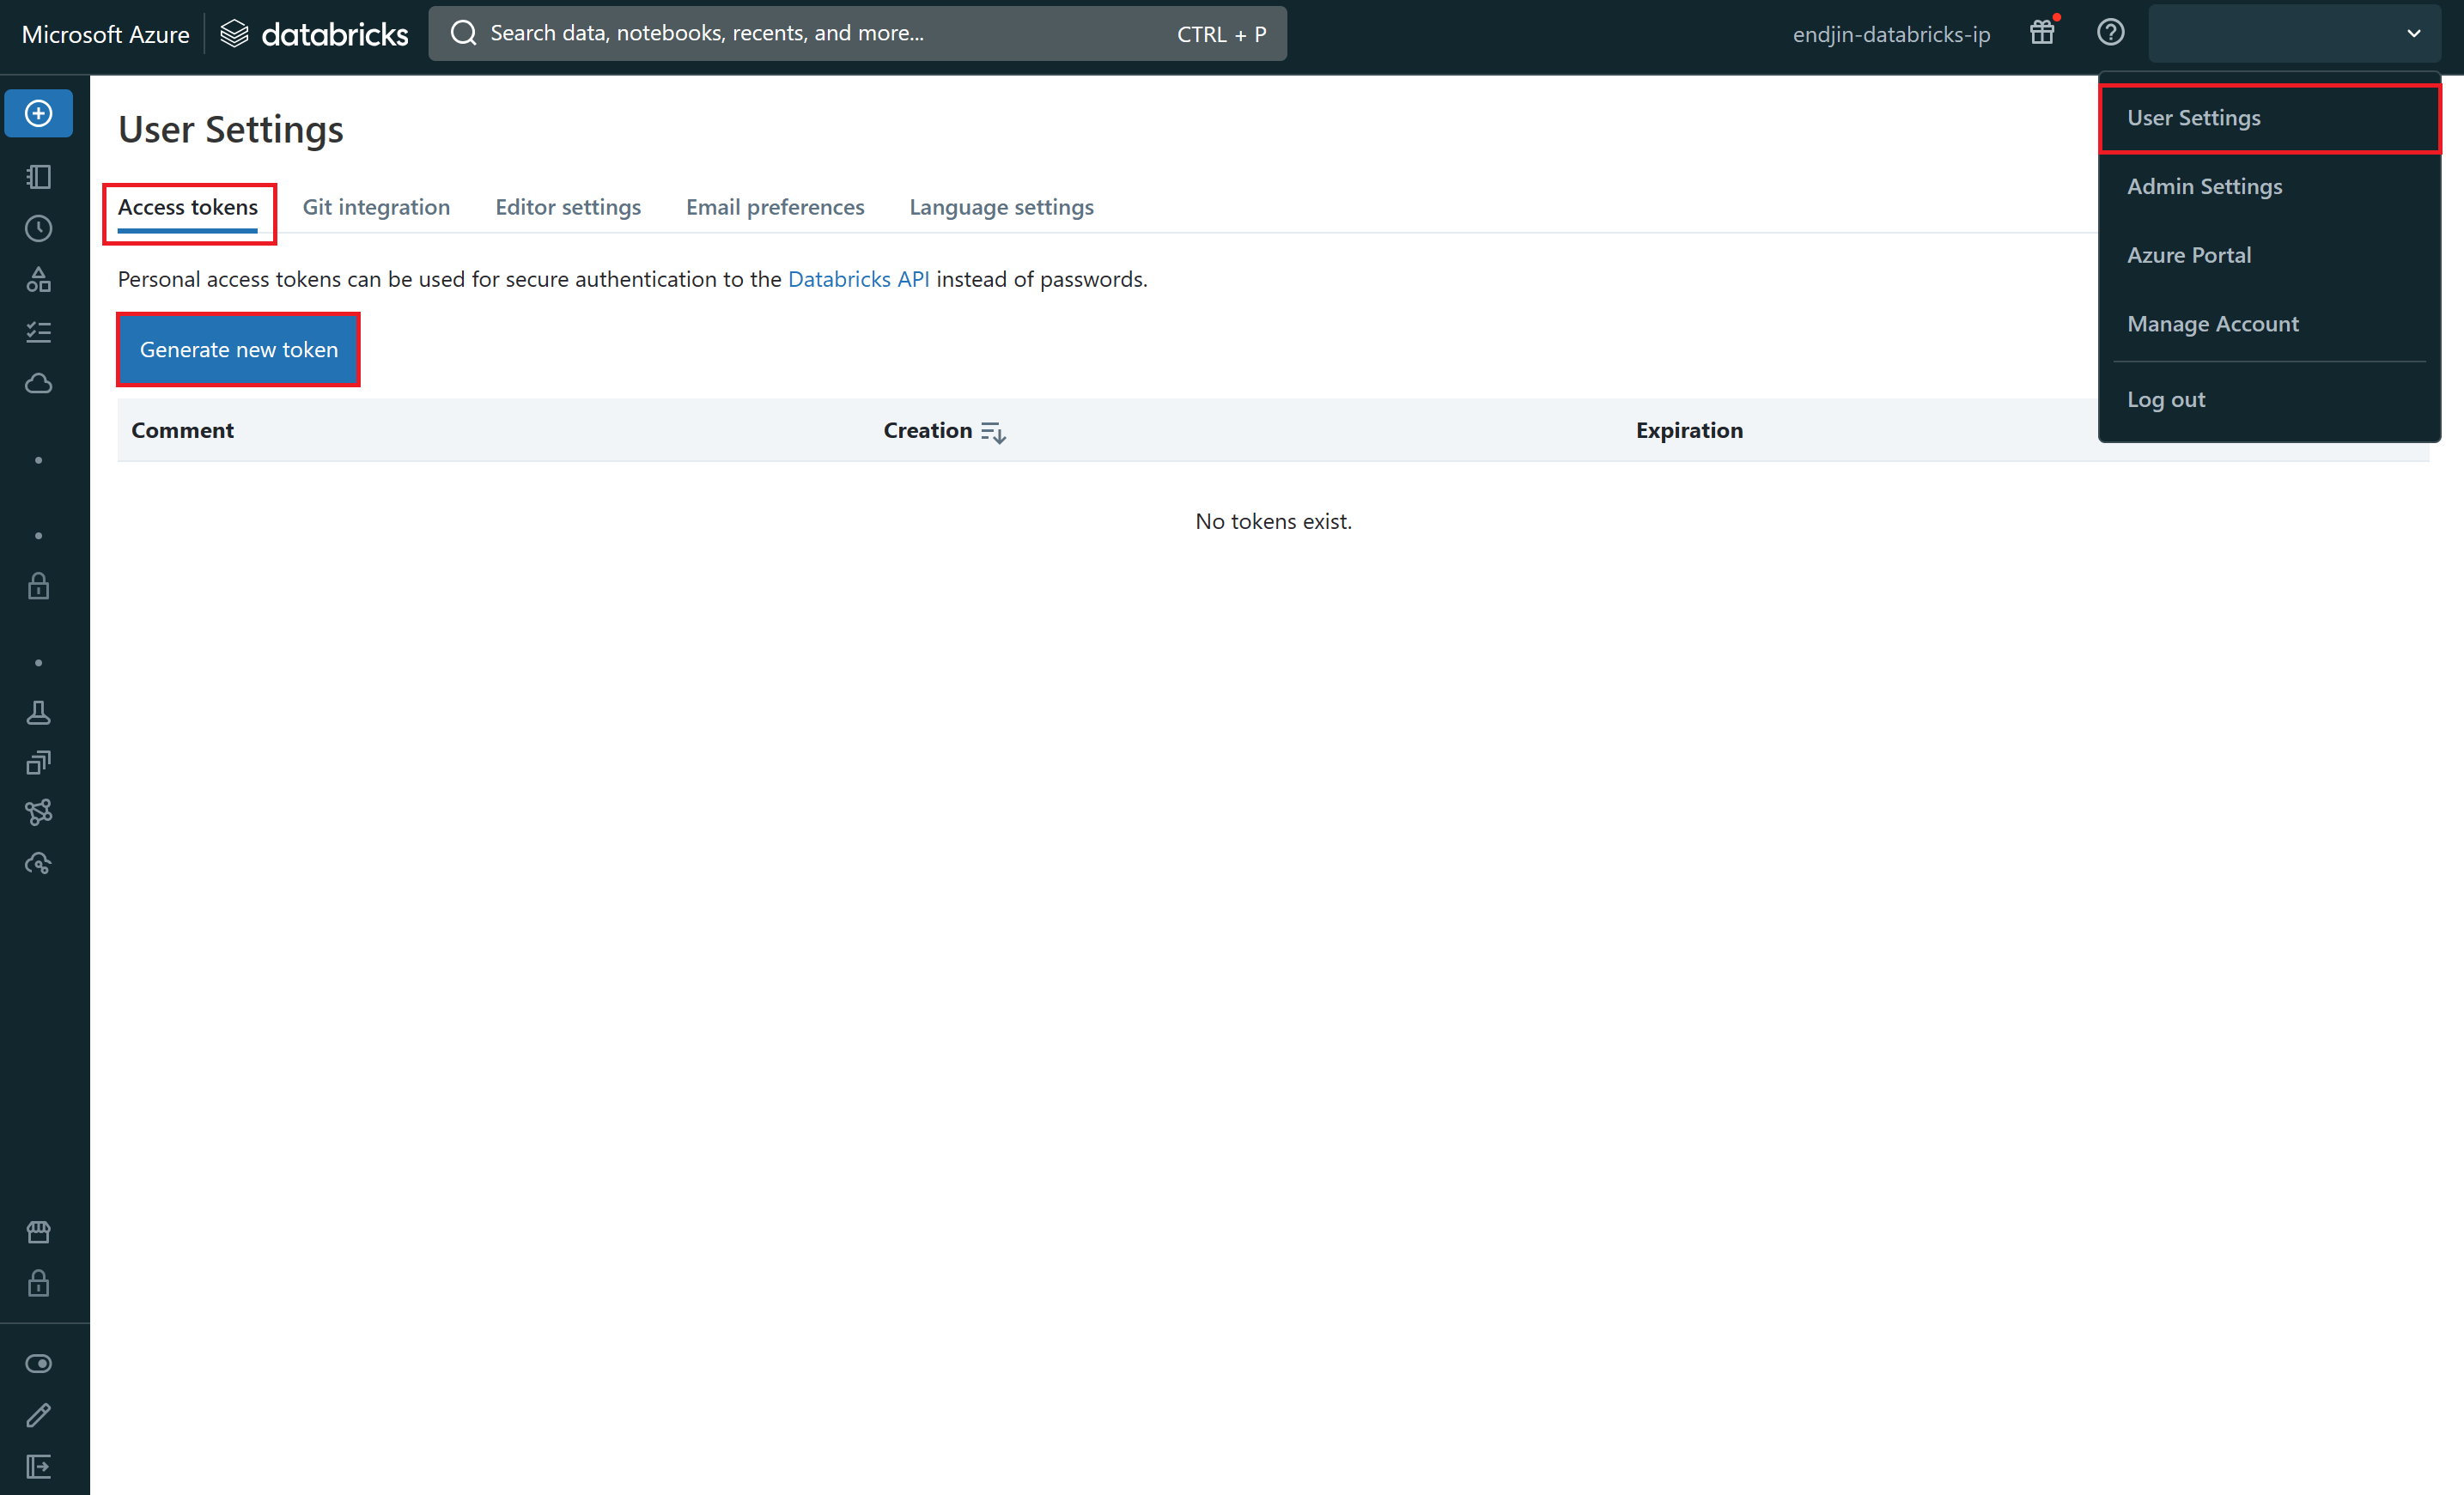
To do this, you need to authenticate your ADF/ASA Pipeline with the Azure Databricks workspace. To enable authentication you must first generate an access token for your Azure Databricks workspace. In your Azure Databricks workspace, click your username in the top bar, and then select 'User Settings' from the drop down. On the 'Access tokens tab', click 'Generate new token'.
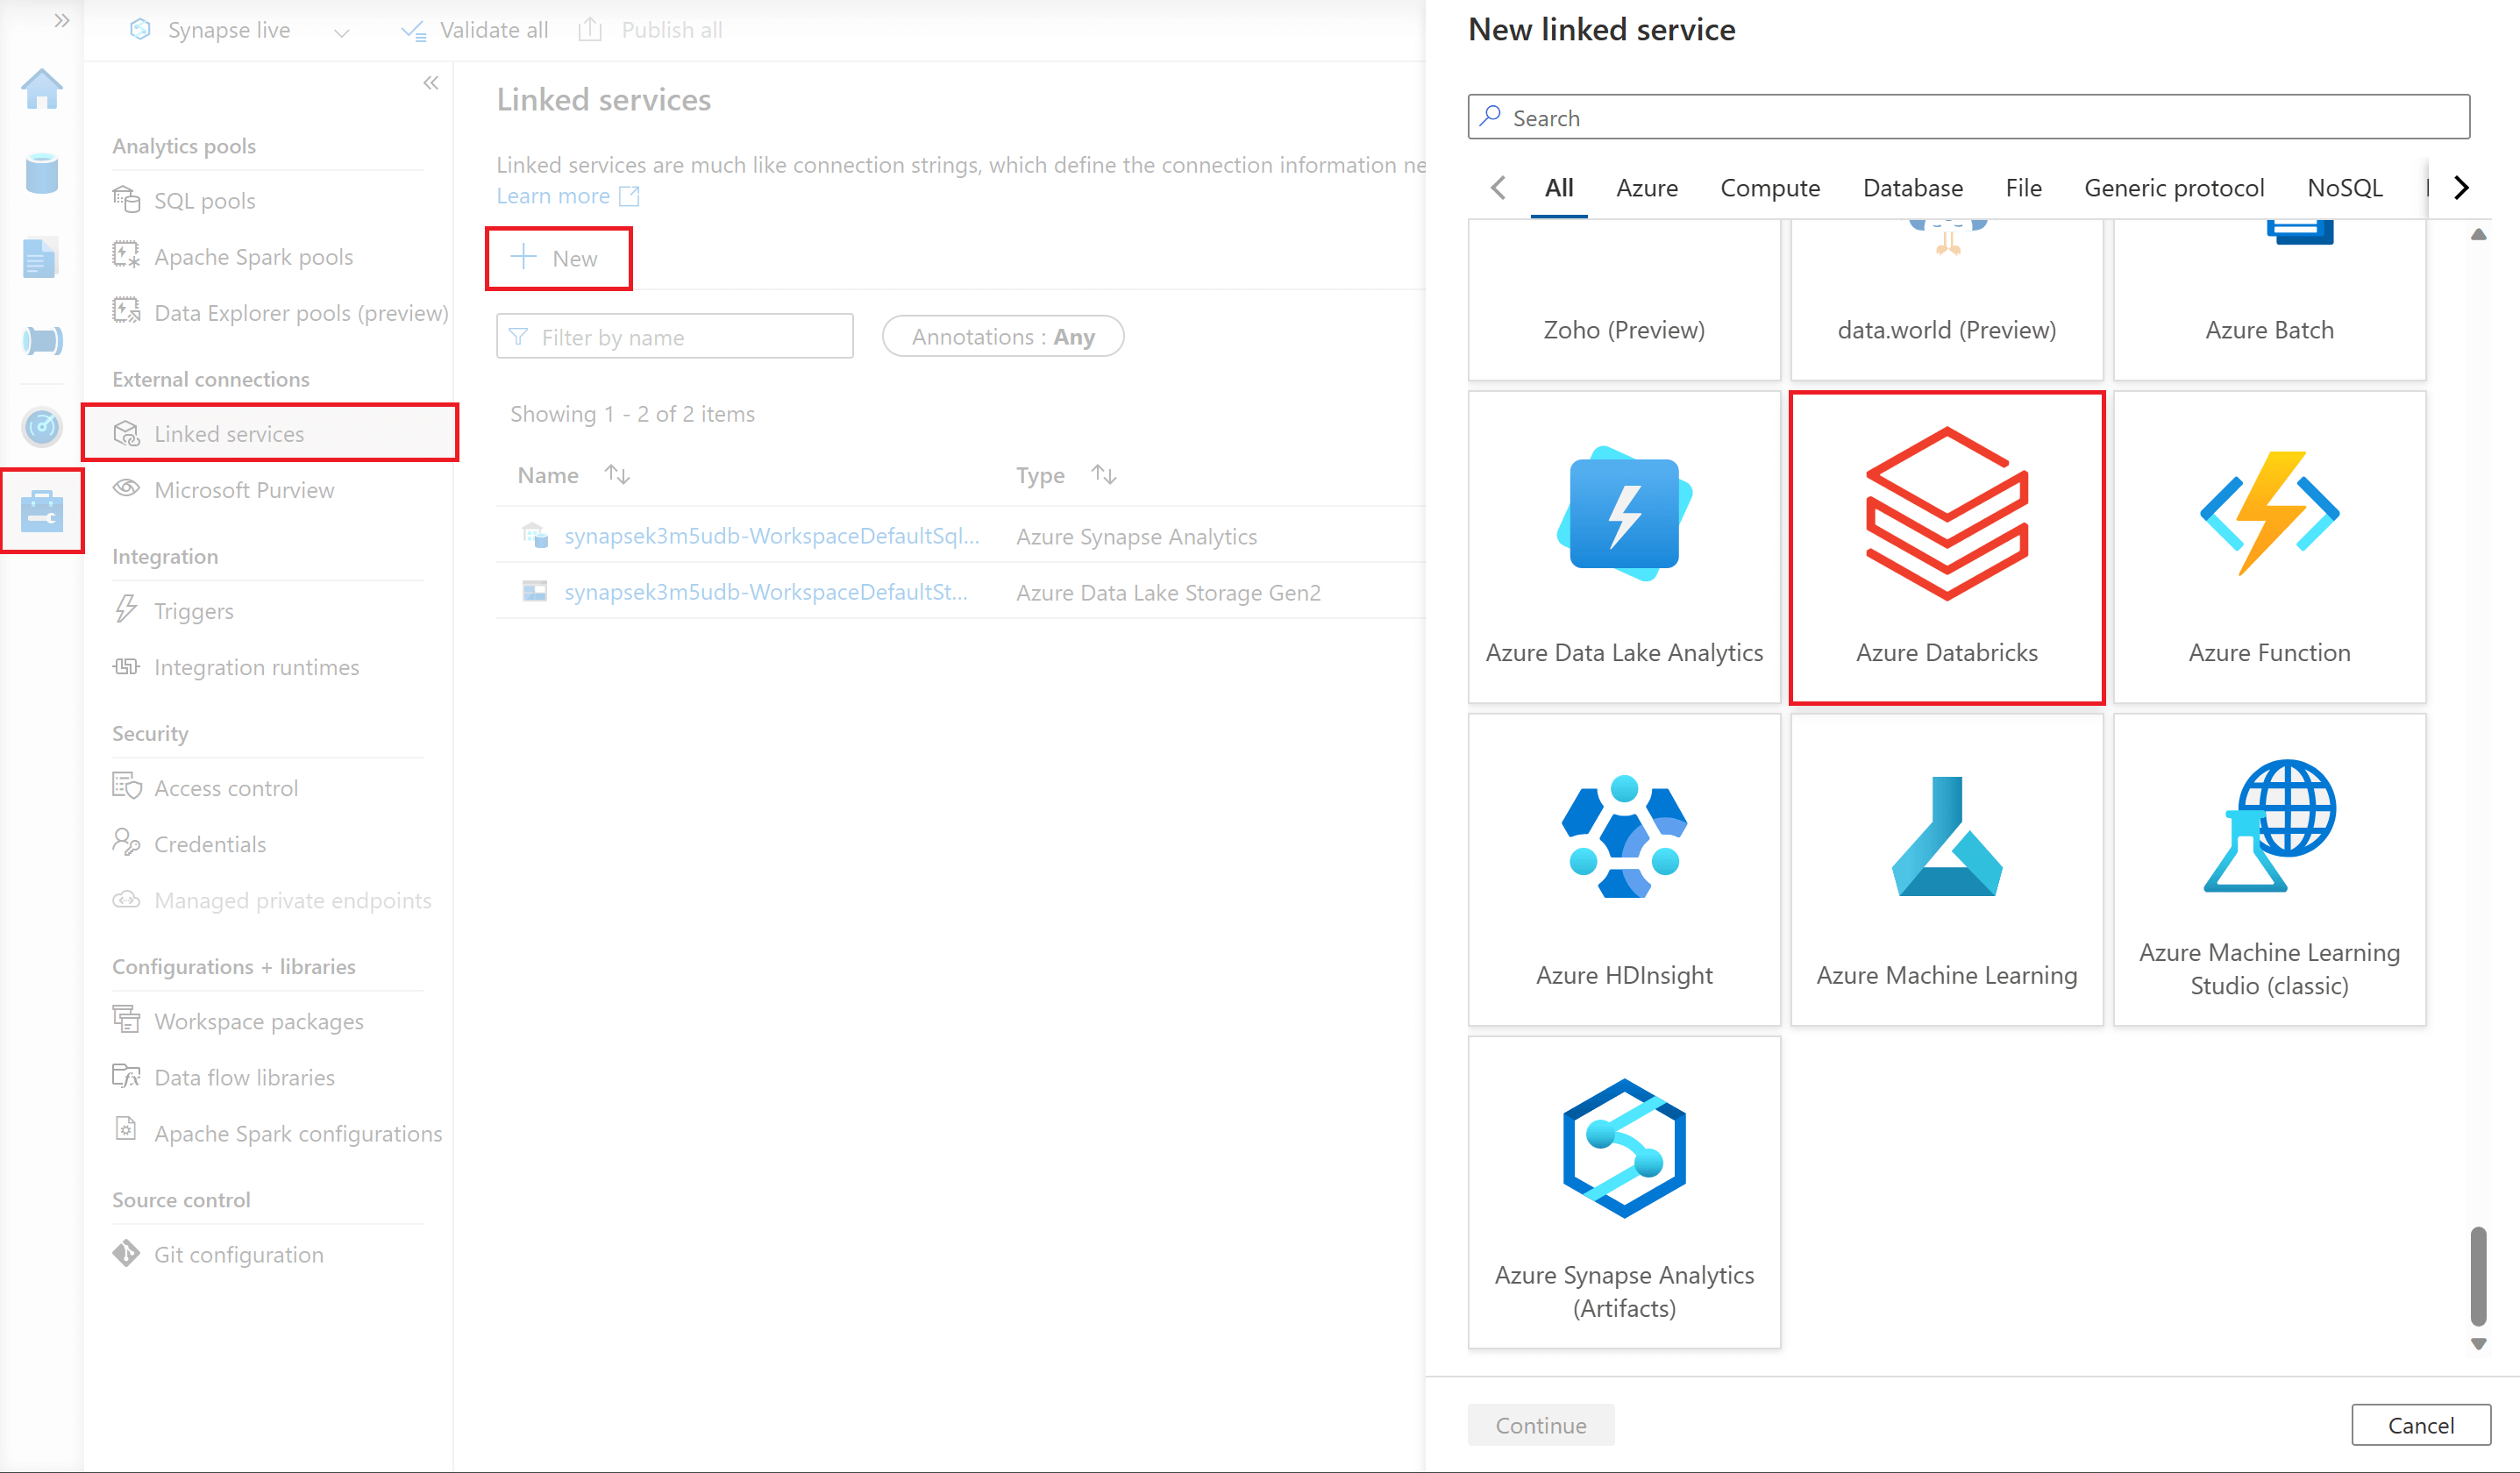
Then you need to create a linked service in your ADF/ASA resource that uses that access token to connect to your Azure Databricks workspace. To do this, you will need to navigate to the 'Manage' section of ADF Studio/Synapse Studio, select the 'Linked services' tab, and then select '+New'. This will launch a 'New linked service' window, here select 'Azure Databricks'.
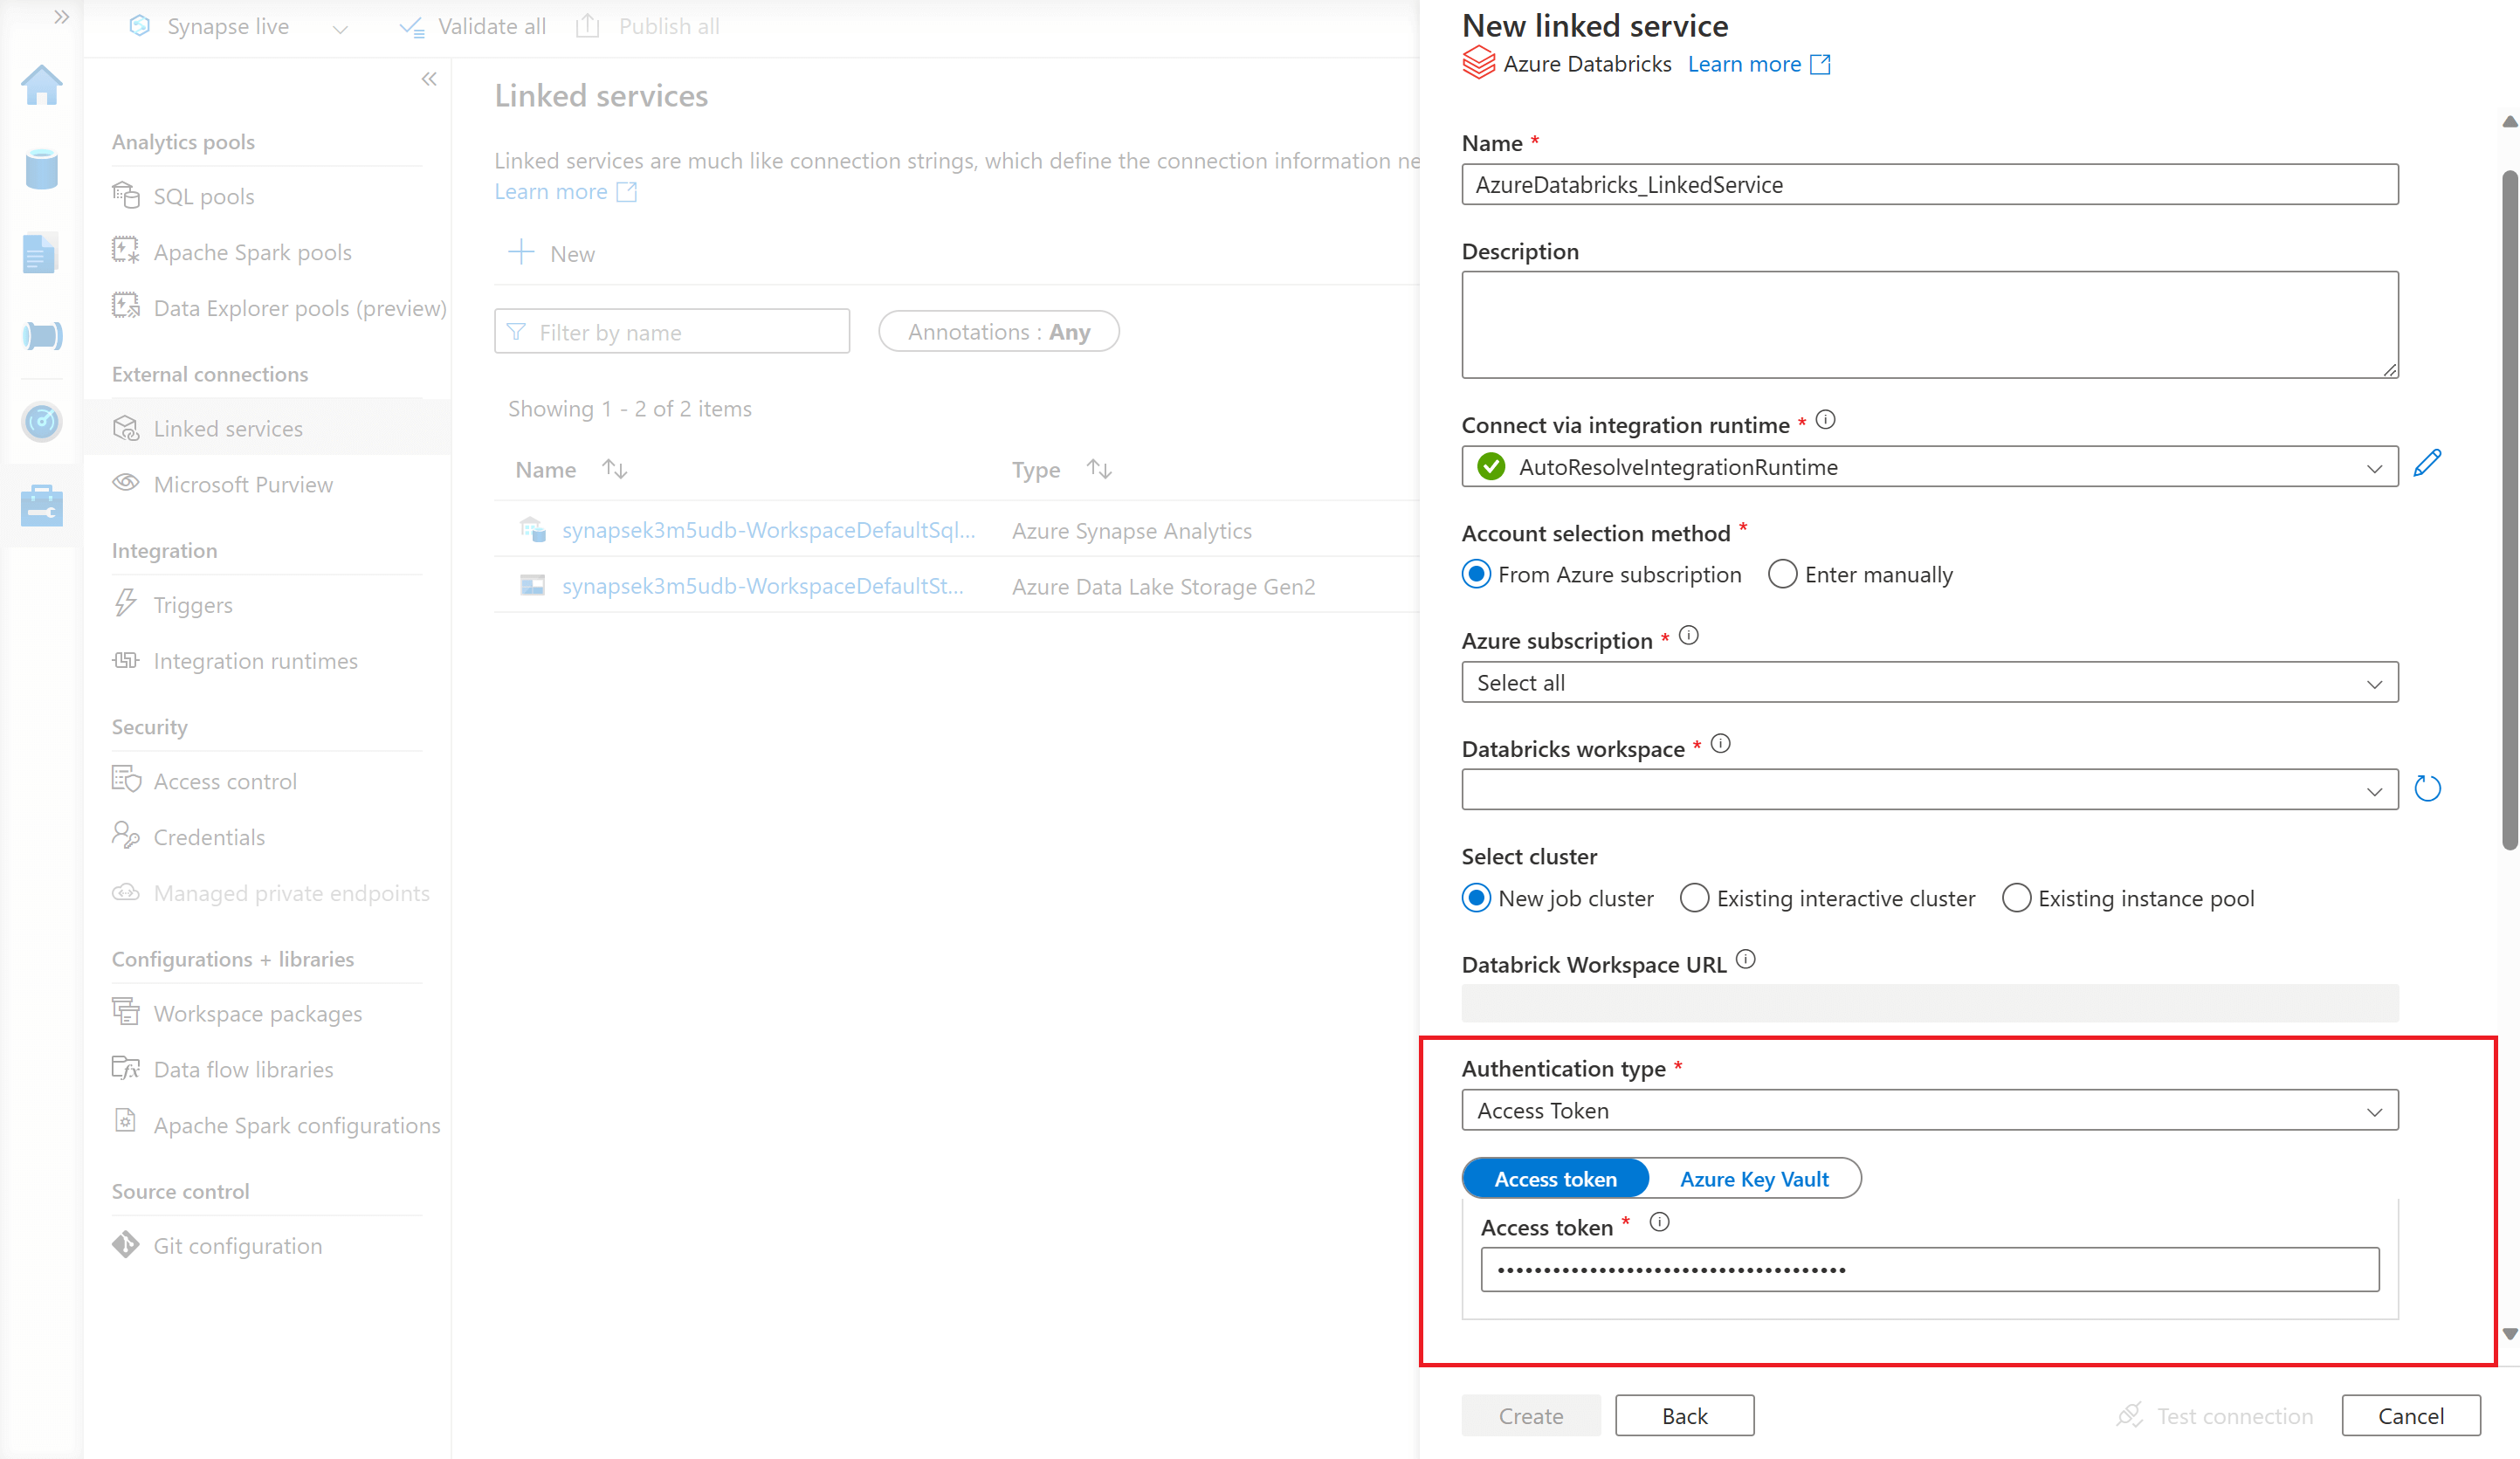
You will then be prompted to configure your Azure Databricks linked service. In the 'Authentication type' field, select 'Access Token' and enter the same access token you have generated from your Azure Databricks workspace.
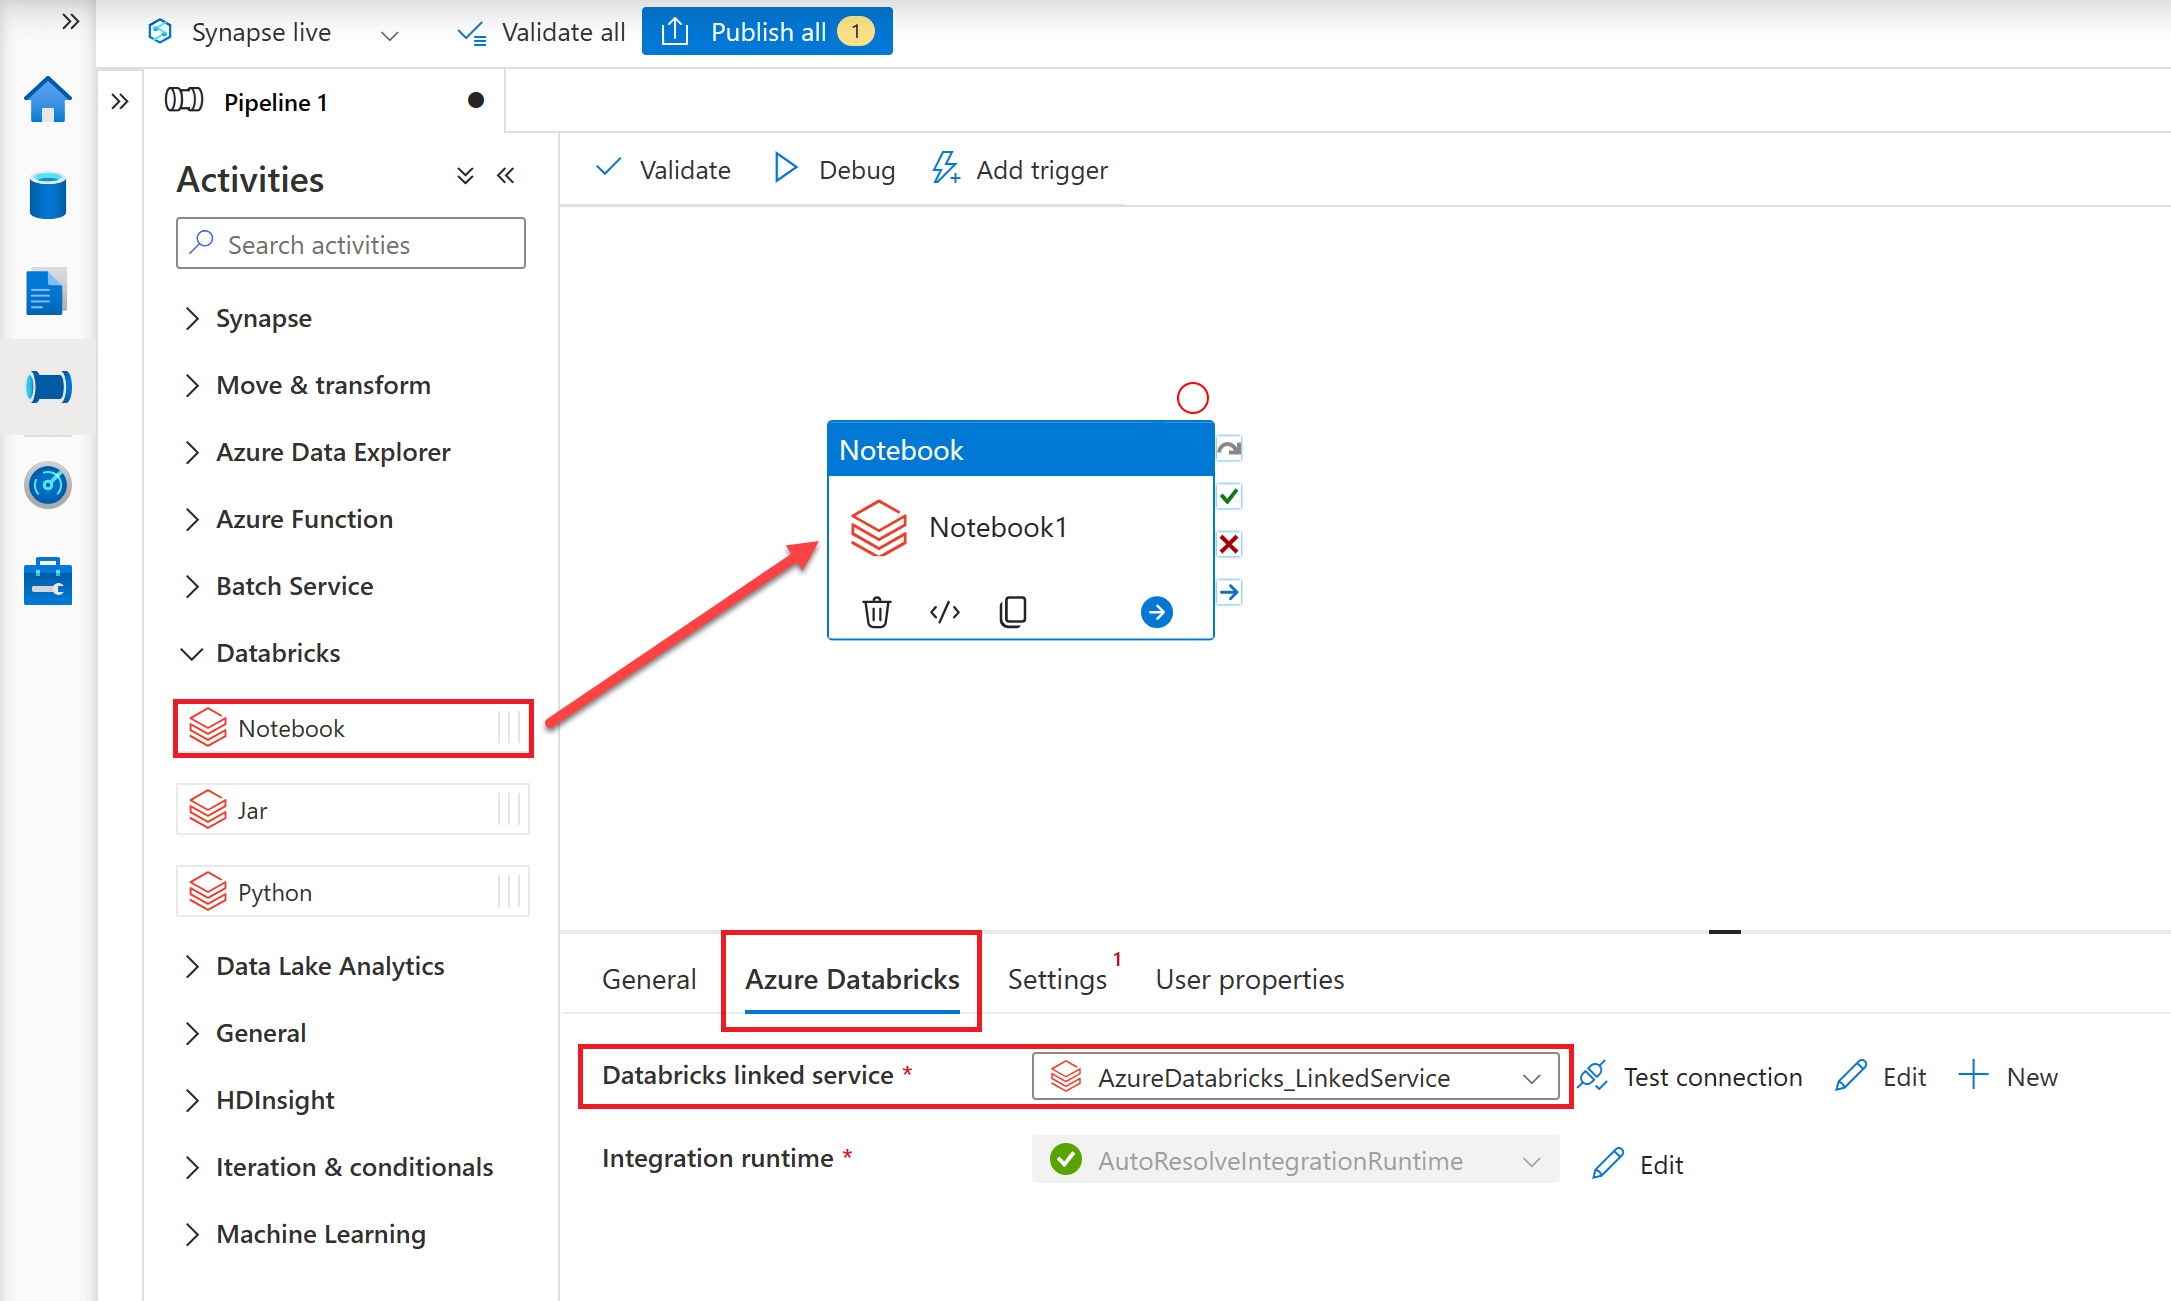
Finally, to add a Notebook Activity to your ADF/ASA Pipeline, in the Activities toolbox, expand 'Databricks' and then drag the Notebook Activity to the pipeline designer surface. Next, click on the 'Azure Databricks' tab and set the 'Databricks linked service' property to the linked service you just created to define the connection to your Azure Databricks workspace.
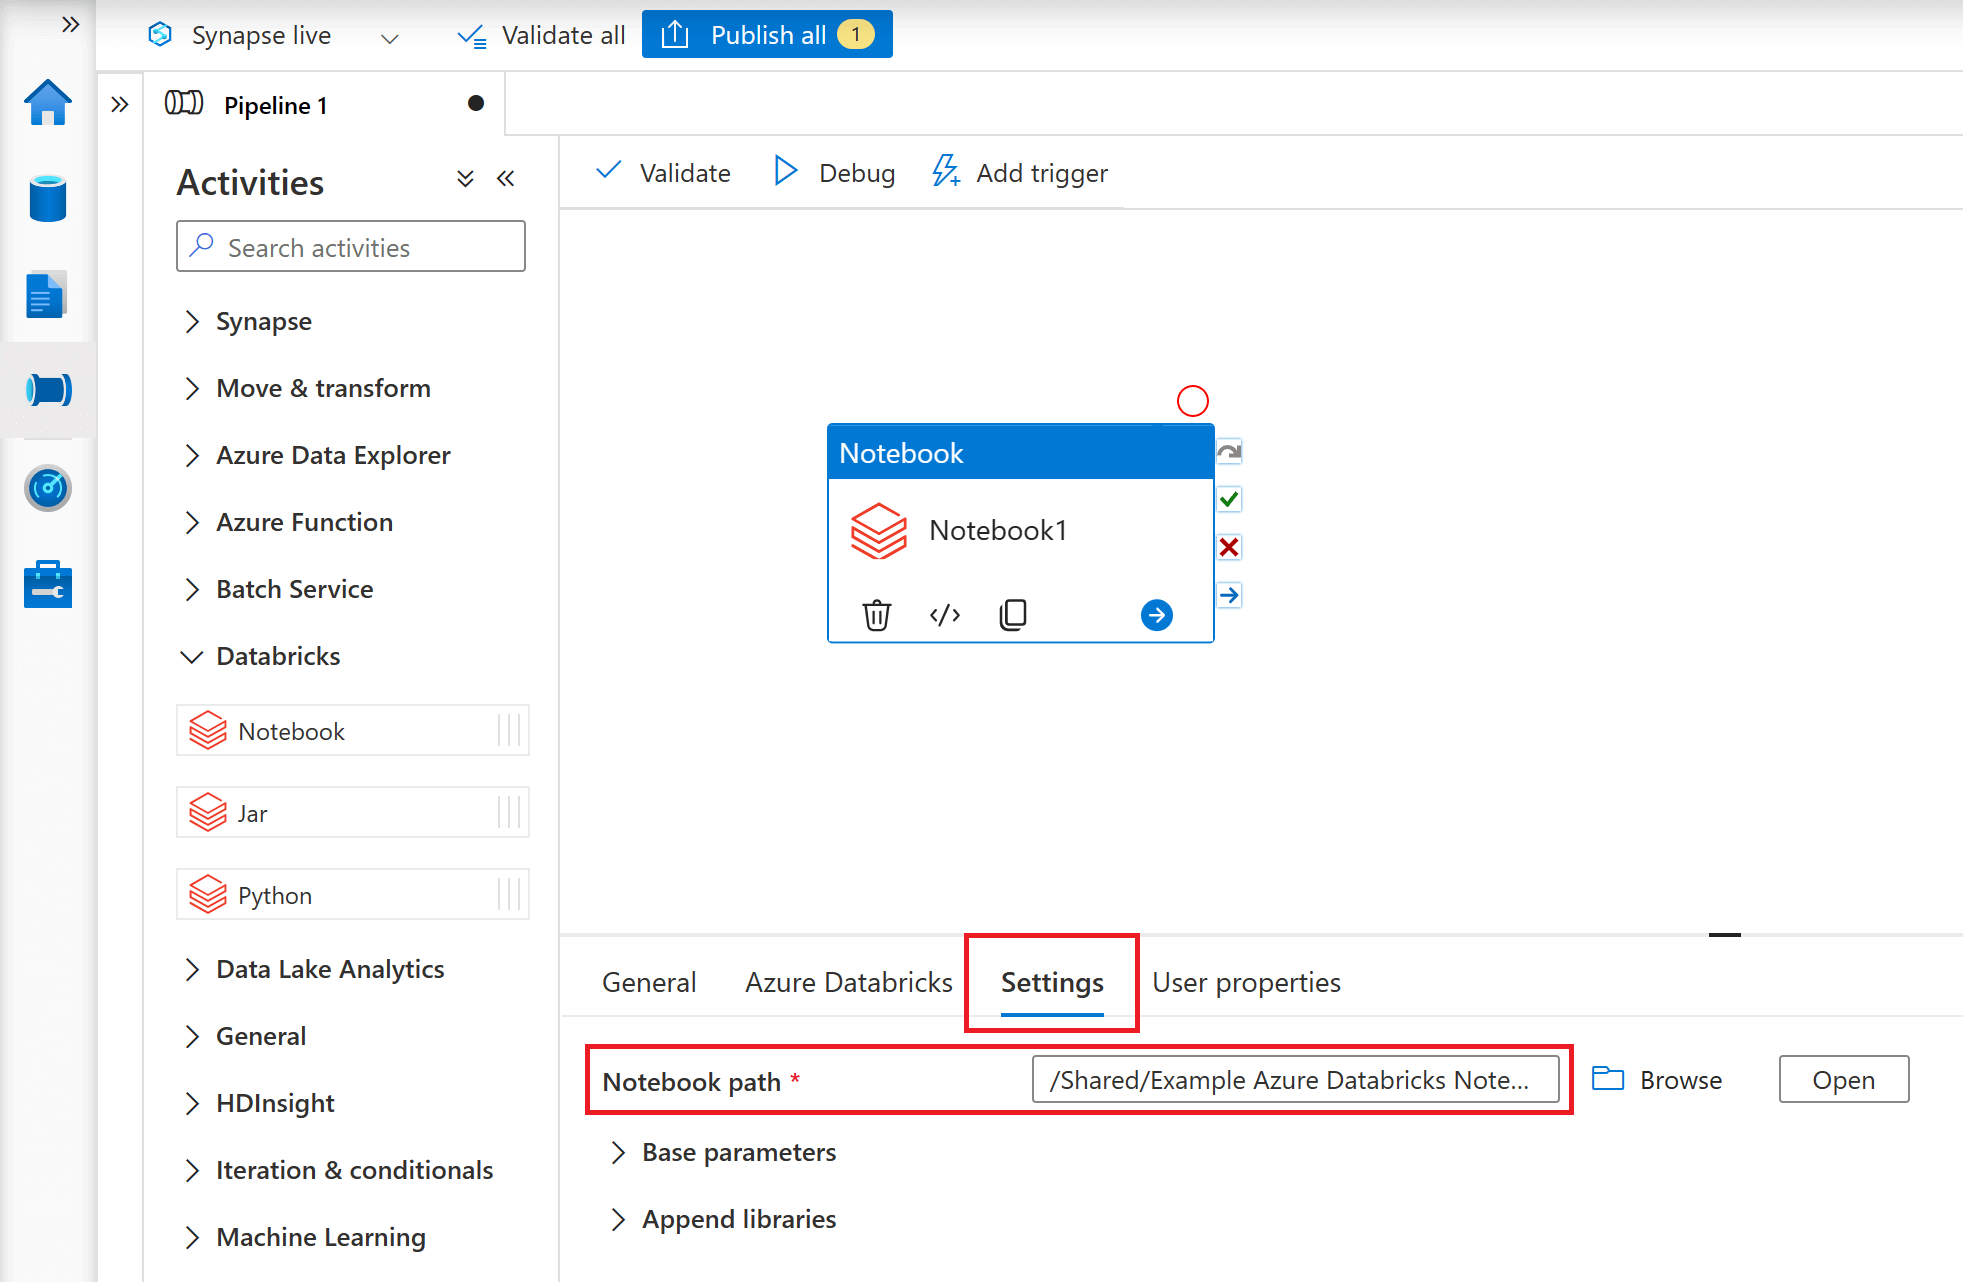
Finally, navigate to the 'Settings' tab to specify the 'Notebook path' of the notebook stored within the connected Databricks workspace that you would like to incorporate into your ADF/ASA pipeline.
Pass Parameters to Azure Databricks Notebooks
You can use parameters to pass variable values to an Azure Databricks Notebook from an ADF/ASA Pipeline. Parameterising your notebooks enables greater flexibility than simply using hard-coded values in the notebook code.
To supply parameters from an ADF/ASA Pipeline, you will need to navigate to the 'Base parameters' section under the 'Settings' tab. Here you can set the parameter values you want to send to your Databricks Notebook.
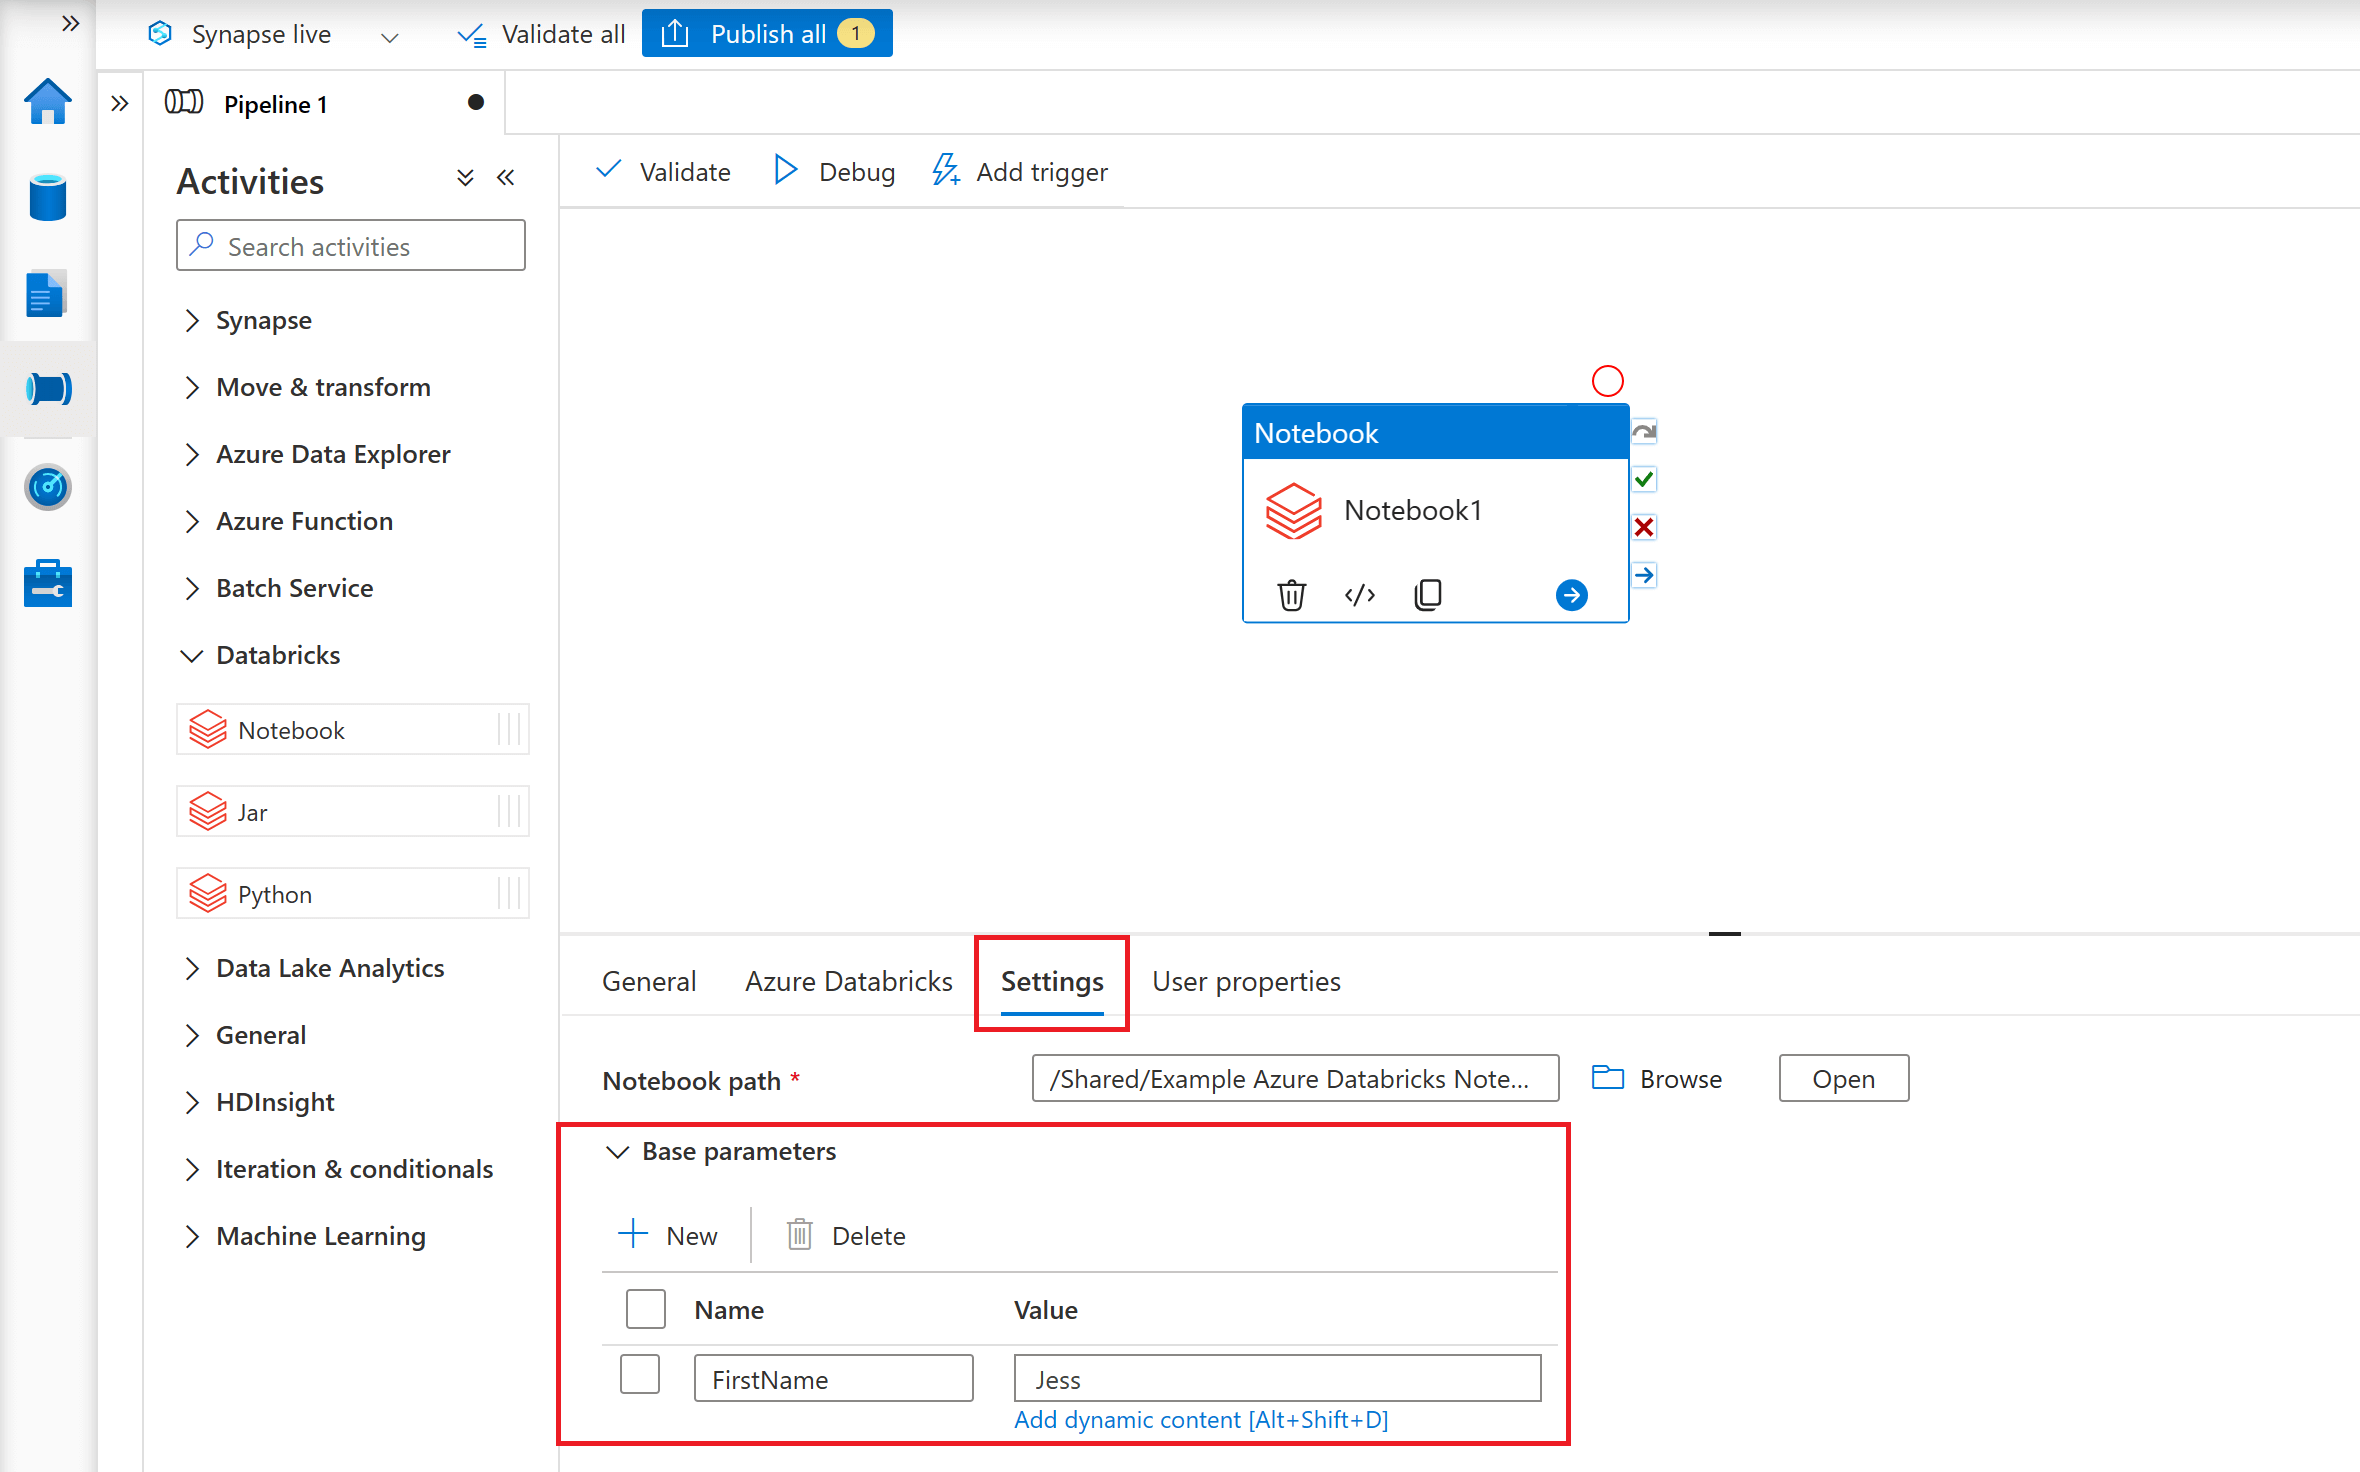
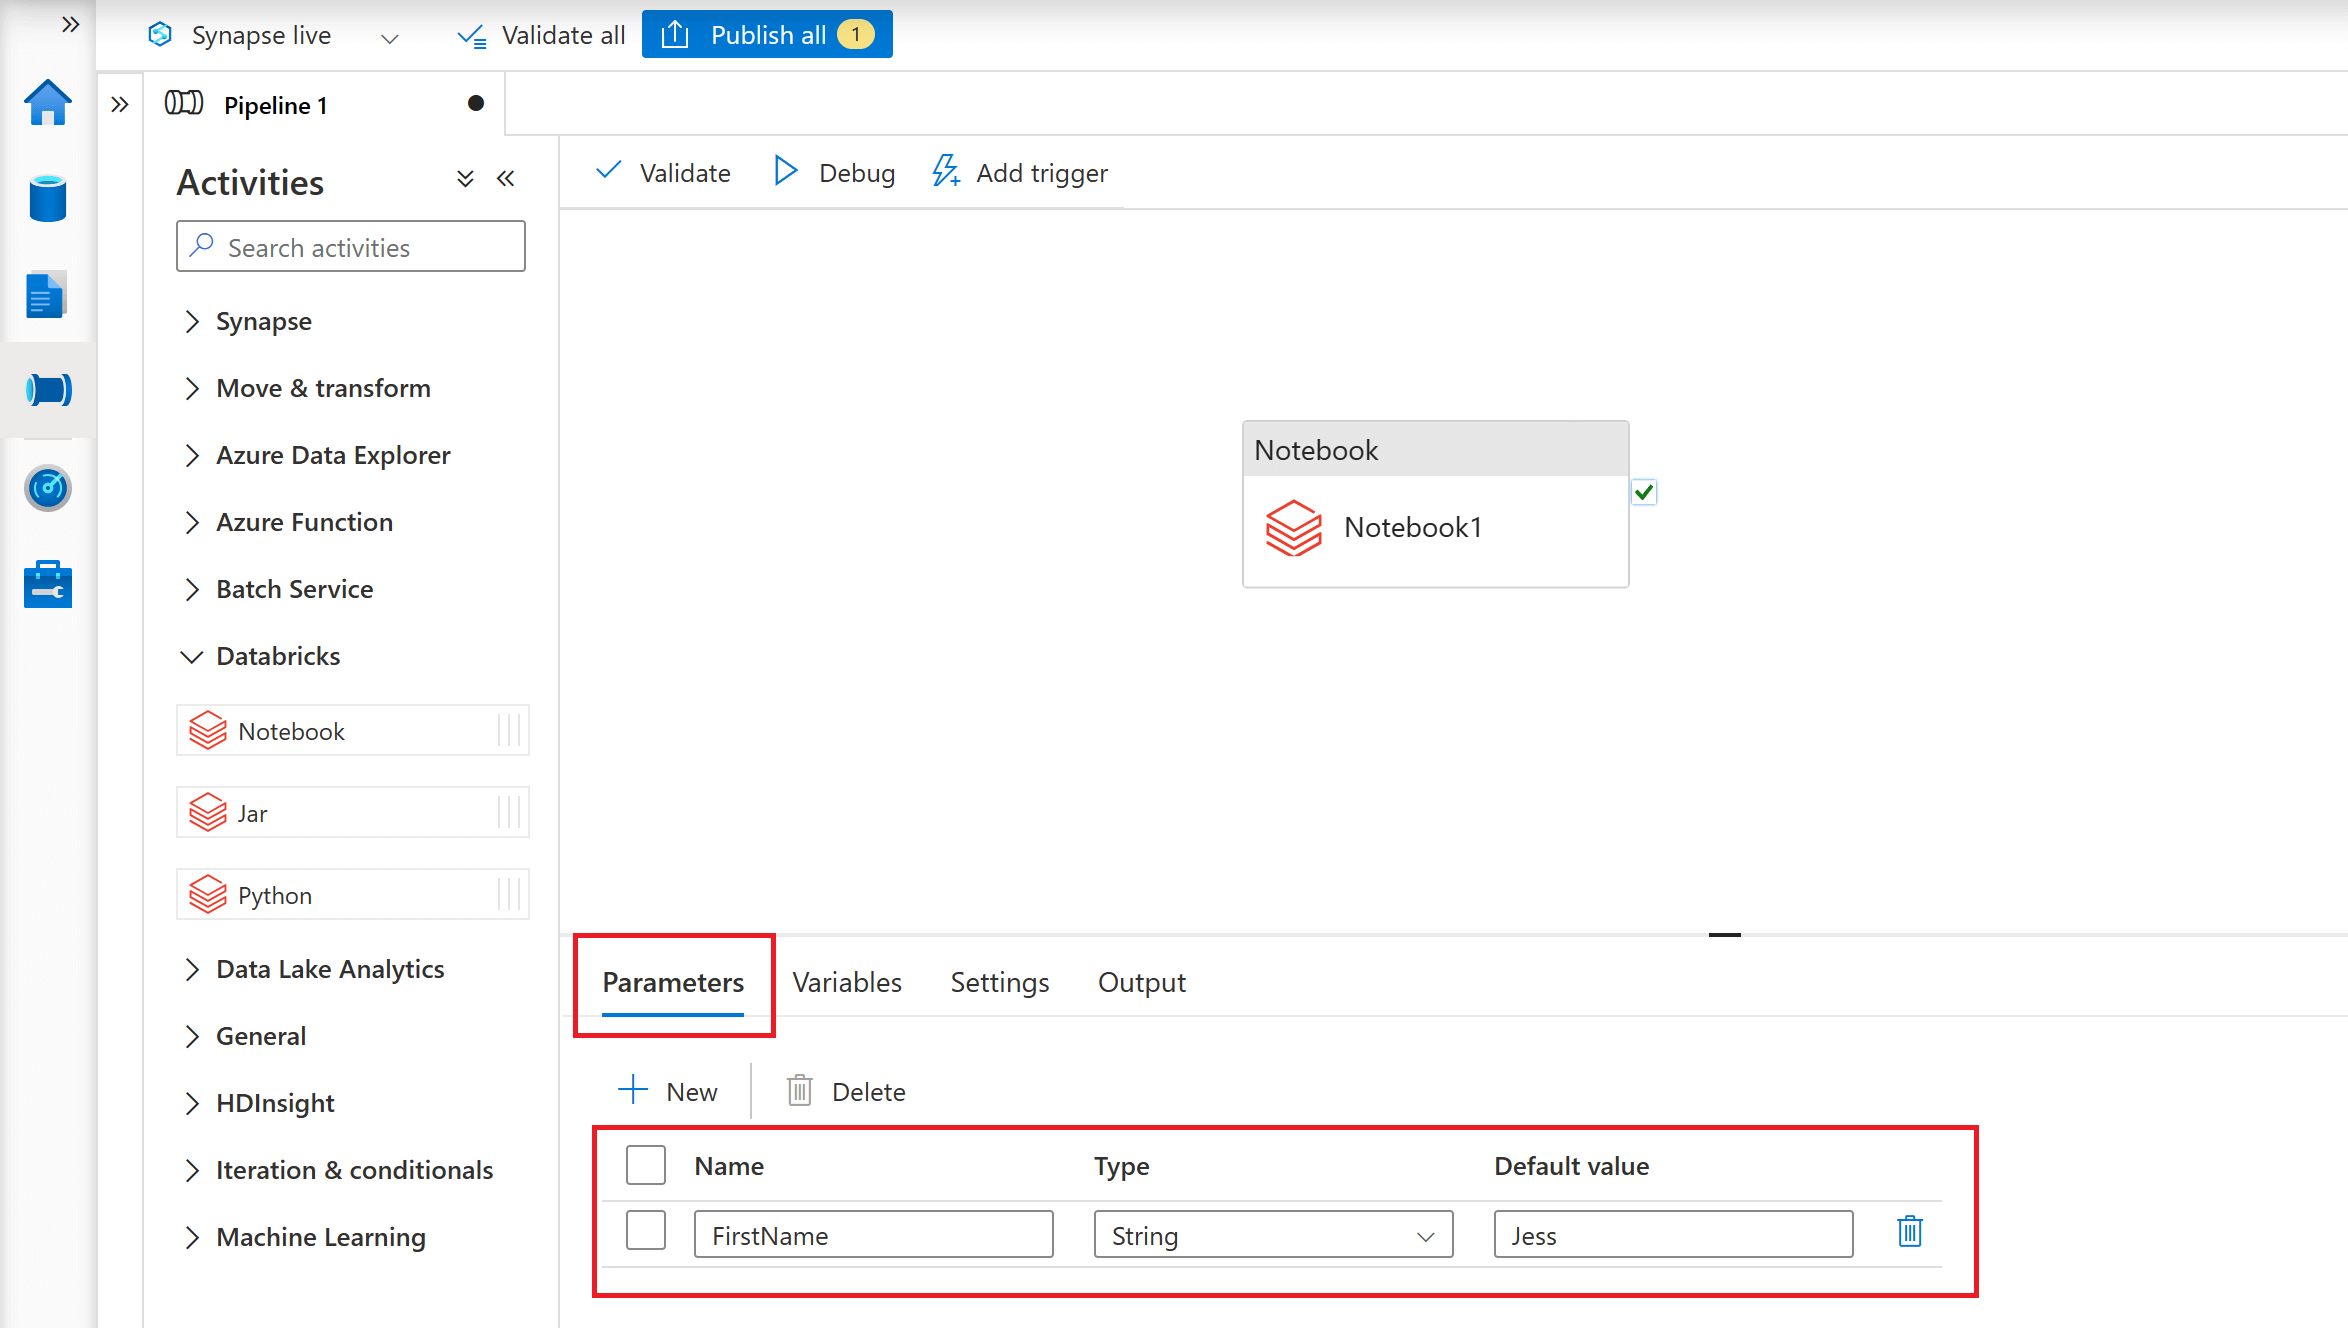
The parameter value here is explicitly specified as a property of the Notebook Activity. You can also add a further level of abstraction by defining a pipeline parameter and then assigning its value dynamically to the Notebook Activity's base parameter.
To accept incoming parameters from an ADF/ASA Pipeline, you will need to use widgets in your Azure Databricks Notebook code. Widgets in Azure Databricks allow users to provide input values to a notebook at runtime. They are used to parameterise and customize notebook execution without modifying the code directly.
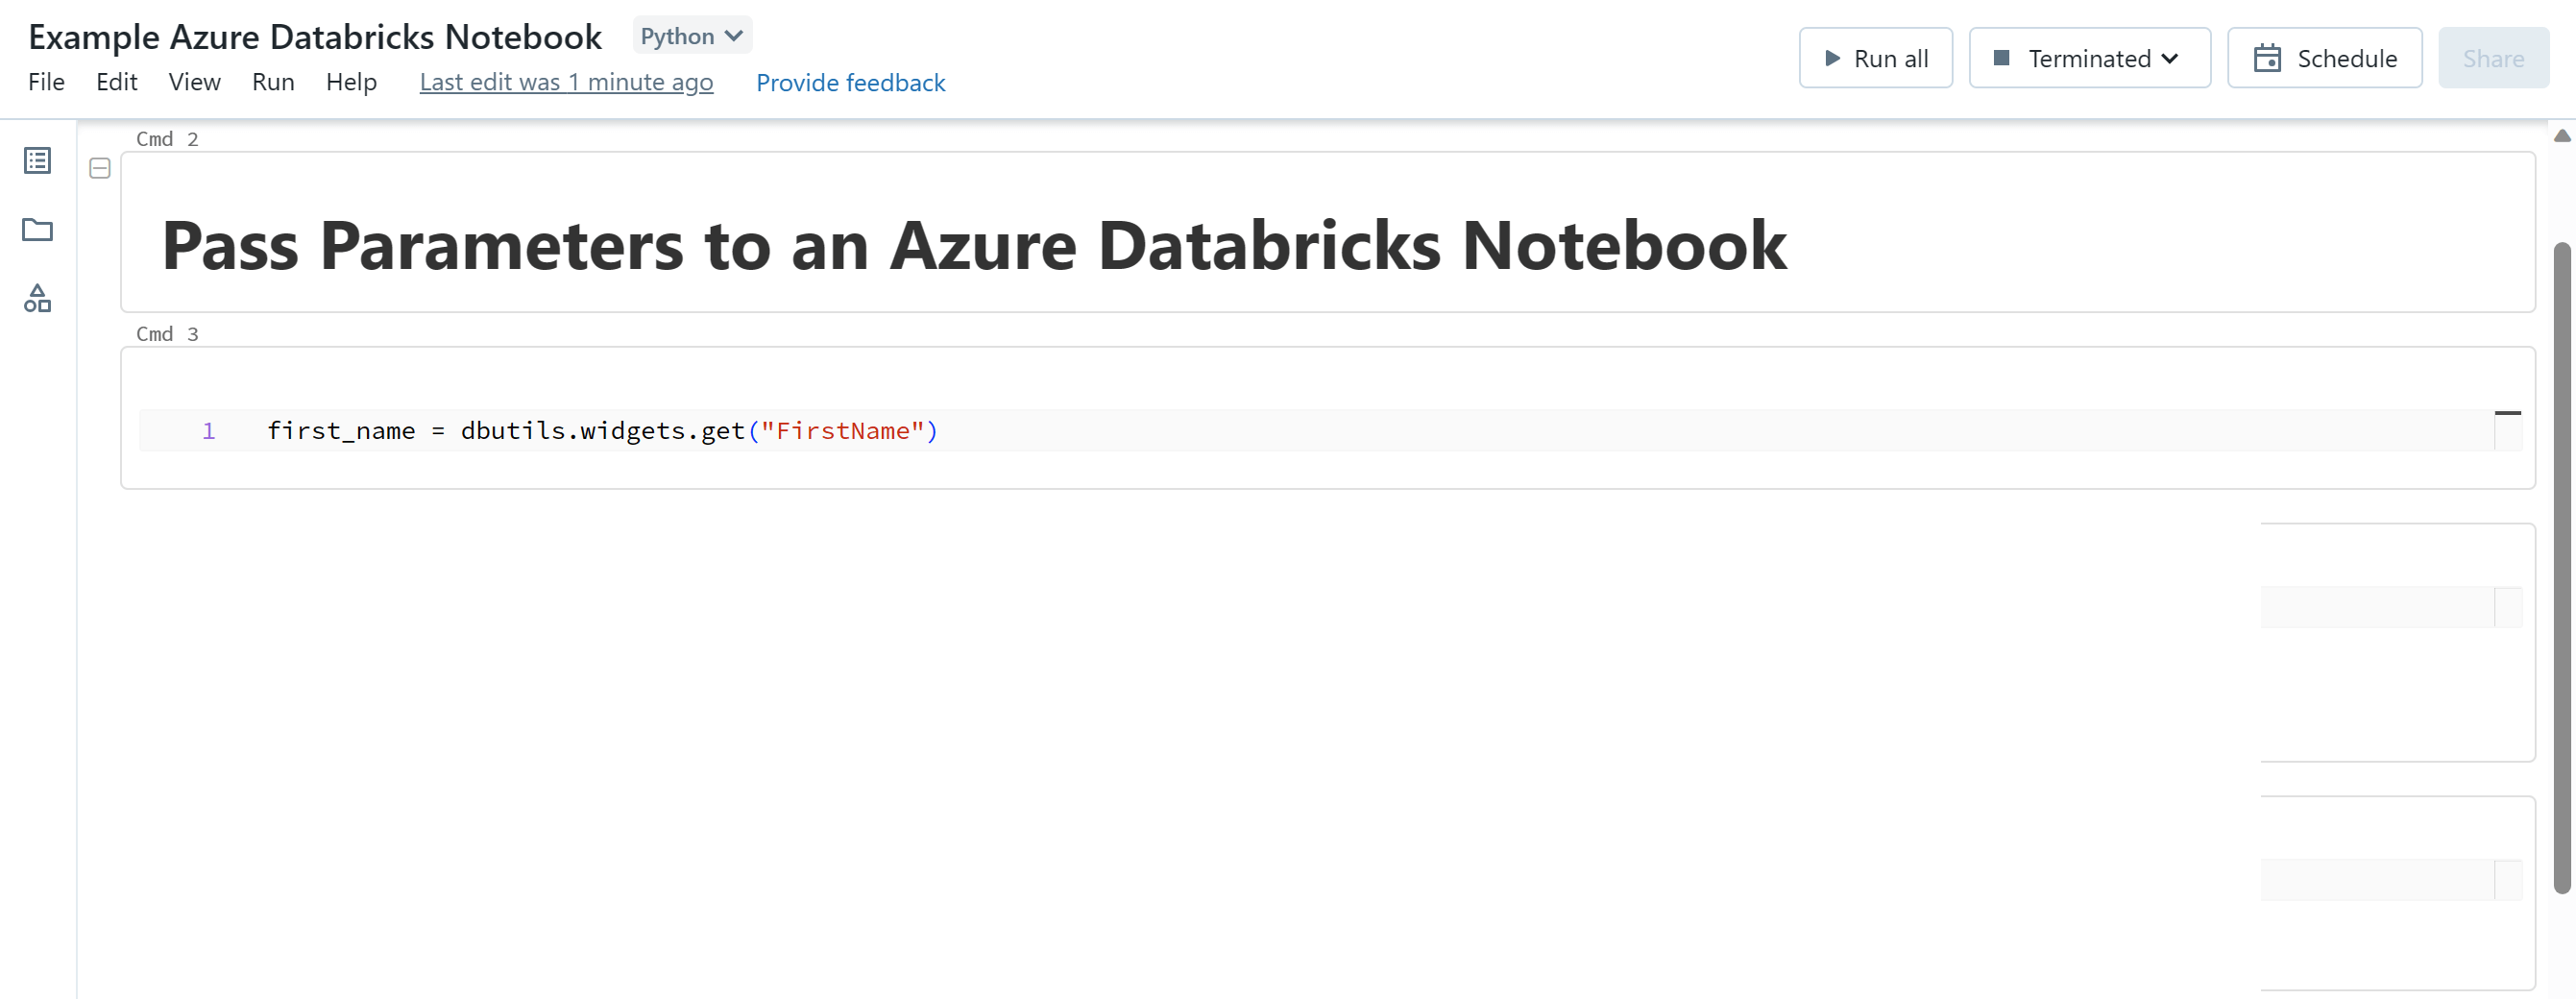
You can use the dbutils.widgets.get() function to retrieve the value for a specific parameter that was passed to the notebook from a pipeline. The following code accepts an incoming parameter value 'FirstName' from a pipeline, and stores its value in a 'first_name' variable.
It is important to ensure that the name of the parameter being sent from your pipeline matches the name of the parameter you have used in your dbutils.widgets.get() function in your Azure Databricks Notebook.
You can also pass values back to the ADF/ASA Pipeline from the notebook by using the dbutils.notebook.exit() function.
Pros and Cons of Azure Databricks Notebooks
Azure Databricks Notebooks support real-time co-authoring in multiple languages along with automatic version control. These features enhance collaboration, accelerate development cycles, improve code quality, and provide safeguards against errors. This is particularly valuable in collaborative data analysis and data science projects where agility, collaboration, and robust code management are crucial.
Azure Databricks Notebooks use an optimized version of Spark designed for large volume, high-performance and high-concurrency Spark usage. It has a lot of extra enhancements to make Spark richer and to allow you to interact with the Spark engine better. These features can enhance the performance, efficiency and scalability of your data processing and analysis workflows. However, depending on your specific use case and requirements, an Azure Databricks solution could be too heavy duty and may have cost implications, particularly if these extra enhancements are not required.
While Azure Databricks offers numerous advantages for data processing and analytics, there are some potential disadvantages, particularly when compared to platforms like Azure Synapse Analytics that provide a more integrated environment with a wide range of tools. Azure Databricks is purely focused on being "the Spark engine". In contrast, in Azure Synapse Analytics, there are a whole suite of different tools baked in of which Spark is just one piece of that jigsaw.
Integrating Azure Databricks Notebooks with other tools or services can introduce additional complexity and can require more effort in terms of configuration. For example, adding an Azure Databricks Notebook to a pipeline involves integrating with other non-Databricks tools such as Azure Data Factory which requires a number of steps to configure. In contrast, in Azure Synapse Analytics, a Synapse Notebook can be seamlessly integrated into a Synapse Pipeline at a click of a button. This additional overheard may be disadvantageous, particularly for new users where a steeper learning curve is required.
Conclusion
This blog post has explored the key features of the notebook experience in Azure Databricks and has demonstrated how quickly and easily you can get set up with Azure Databricks Notebooks to start exploring and generating insights from your data.